Python Vibe Coding Course — Part 3
Vibe Coding with LLM
Ask ChatGPT to write your code
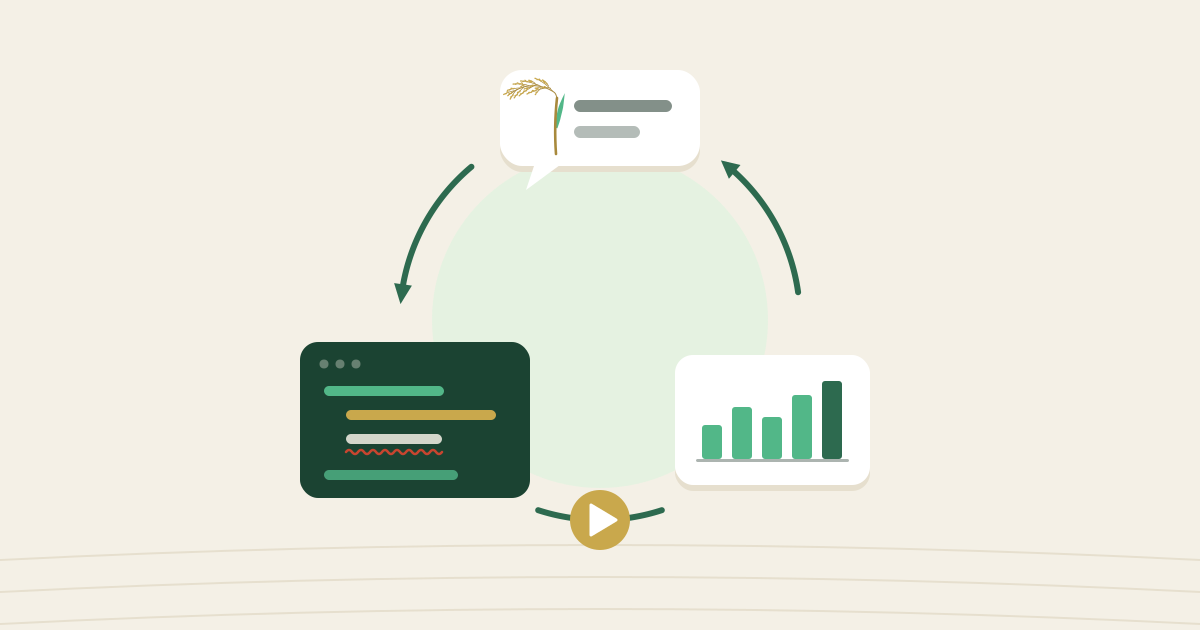
With the environment from Part 2 ready, this is where the course gets exciting. In this part, you will develop the habit of describing the analysis you want in plain English to an LLM, having it write Python code as an .ipynb file, and running it in VSCode on your own PC. Even if you cannot write code, you can ask an LLM to write it for you. When errors occur, you can ask the LLM to fix them. This back-and-forth style is called "vibe coding."
What is vibe coding?
Vibe coding is a coding style where, instead of writing code yourself, you describe your intent in natural language and have an LLM write the code for you. Tell it "I want to run this analysis" or "I want to read this CSV and aggregate by column," and the LLM translates that into Python code.
As we saw in Part 1, Python is the language LLMs handle best, because so much Python code and discussion is publicly available. That is the foundation that makes vibe coding work so well.
For this course, the free versions of ChatGPT (OpenAI) or Claude (Anthropic) are more than enough. Both free plans can handle everything in this course.
Paid plans (ChatGPT Plus, Claude Pro) give access to more capable models that write more accurate code. However, the free plan is plenty to start. Consider upgrading once you've gotten comfortable.
Before anything else, protect personal and confidential data
Before you start using an LLM, here is one absolute rule. It comes first so you don't accidentally share sensitive information as you work through the examples.
Never send any of the following to an LLM.
- Raw experimental data (especially anything that contains information about study participants or can identify a person)
- The text, figures, or tables of an unpublished manuscript
- Information covered by a confidentiality agreement in a collaborative project
- Personal information (names, addresses, IDs, etc.)
The only thing you should send to an LLM is the structure of your data (column names, what each column means, approximate row count). For example, a prompt like the one below is perfectly fine.
The key is to describe only the shape of your data to the LLM. The code runs entirely on your own PC, so the data itself never leaves your machine.
Using the "Temporary Chat" feature
Both ChatGPT and Claude offer a Temporary Chat mode, where the conversation is not used as training data and does not appear in your chat history. This is useful for sensitive requests or when discussing your lab's internal data structure.
- In ChatGPT, use the "Temporary Chat" toggle near the account icon in the top right
- In Claude, check the settings when starting a new chat, or under Account → Privacy settings
Using Temporary Chat does not mean it is safe to send actual data. Think of it as an additional safeguard on top of keeping shared information to the bare minimum.
Start by extracting your data structure and sharing it with the LLM
As Step 02 established, you cannot send your raw data to the LLM. But without knowing your data structure (column names, types, row count), the LLM cannot write accurate code. The solution is a two-step workflow that forms the foundation of vibe coding. You extract a structural summary of your data locally, then share only that structural information with the LLM. If you skip this step, the LLM will guess column names or types incorrectly, so always start here.
Steps
- Ask the LLM, "Please write a short code snippet that outputs only the structure of my data (column names, data types, missing value counts, and min/max/mean for each numeric column)"
- Run the returned code in VSCode
- Copy the output (structural information only, with no personal data)
- Paste that output back into the LLM and continue with, "Based on this data structure, please write the code to perform [X] analysis"
Once you paste the output (e.g., "Columns are A, B, and C. A is numeric, no missing values, min 0.5, max 12.3...") back into the LLM, it can return highly accurate code based on your actual data structure. You have not sent any of the data itself, so it stays confidential.
The most important skill is stating your intent clearly and systematically
The most important skill in vibe coding is not learning Python syntax or memorizing useful libraries. It is understanding precisely what you want to do and communicating that to the LLM concretely and systematically.
LLMs are not magic. They infer code from the information you give them. A vague request like "please aggregate my data" gives the LLM no basis for deciding how to aggregate, so the code it returns misses the mark. Conversely, a specific request like "for each unique value in column A, calculate the mean and standard deviation of column B, sort by column A descending, and save the result as a CSV in the results/ folder" will almost always produce exactly what you want on the first try.
☐ Purpose. What is this analysis for?
☐ Input. What data, where, and in what structure? (paste the structural info from Step 03)
☐ Processing. What specific calculation or aggregation do you want?
☐ Output. What to save, where, and in what format?
☐ Constraints. Which libraries to use, what behavior to avoid, etc.
Simply keeping this checklist in mind will dramatically improve the quality of the code the LLM returns. But if you yourself are unclear about what you want, no amount of prompting will produce the right result. Half of the analysis is decided at the "articulate your intent" stage, before any code is written.
Making your first request (ask for an .ipynb file directly)
Open ChatGPT (or Claude) and start a new chat. Both ChatGPT and Claude can now output an .ipynb file directly and make it available for download. There is no need to copy and paste code cell by cell. In your first request, explicitly ask, "Please write this as an .ipynb file and make it available for download."
Turning on web search improves accuracy. For questions about the latest version of a library or recent fixes for an error, enable the web search icon (globe icon) in the ChatGPT input bar before sending your prompt. Claude has a similar web search feature. This is especially useful for newer libraries or version-specific questions.
[Purpose]
Examine the relationship between biomass and leaf area in a new crop variety.
[Folder structure]
- The notebook is at notebooks/analysis.ipynb
- Raw data is in the data/ folder, and outputs go in the results/ folder
- So in code, read data from ../data/ and save results to ../results/ (create results/ if it doesn't exist)
[Input]
data/sample_data.xlsx (from the notebook: ../data/sample_data.xlsx)
- Columns: "Sample ID" (string), "Biomass", "Leaf Area", "Nitrogen Content" (numeric)
- Rows: approximately 100
- (paste the detailed structural output from Step 03 here)
[Processing]
- Calculate basic statistics for each column
- Create a scatter plot of "Leaf Area vs Biomass" with a regression line
- Calculate the correlation coefficient and p-value
[Output]
Save scatter.png (scatter plot) and statistics.csv (summary statistics) to the project's results/ folder (from the notebook: ../results/).
[Constraints]
- Add English comments to each cell explaining what it does
- Please output this as an .ipynb file named analysis.ipynb and make it available for download
Once the LLM generates the file, a download link will appear. Then follow the steps below.
- Download
analysis.ipynbfrom the link (it typically saves to your Downloads folder) - In Explorer/Finder, move the downloaded
analysis.ipynbinto themy_first_analysis/notebooks/folder you created in Part 2 - With the folder open in VSCode, click
analysis.ipynbto open and run it
If you place the file anywhere other than notebooks/, the code's relative paths (e.g., "../data/sample_data.xlsx") will fail to find the data, producing a FileNotFoundError. Always place the notebook inside the notebooks/ folder (it reads data from ../data/).
Running the code, partial edits, and full rewrites
Open the downloaded analysis.ipynb in VSCode. Run the cells from top to bottom (Shift + Enter). As you review the output, ask the LLM in plain English for any changes you want.
Example of a partial edit
· Set the chart title to "Leaf Area vs Biomass (n=100)"
· Change the point color to green
· Use English labels for both axes
Example of a full rewrite
If you want to fundamentally change the approach, simply ask for a full rewrite.
Handling errors
Errors will happen. In fact, it would be unusual for the first run to be error-free. There is no need to panic when errors appear. All you need to do is copy the entire error message and paste it into ChatGPT.
---
FileNotFoundError: [Errno 2] No such file or directory: '../data/sample_data.xlsx'
---
The LLM will infer the cause from the error message and return a corrected file. Download the corrected version and run it again. Repeat this cycle as needed.
ModuleNotFoundError means a required library (see Part 1) is not in your virtual environment. Run pip install library-name with (.venv) shown at the start of the terminal prompt.
FileNotFoundError means the file path is wrong. Check the filename and location.
KeyError means a column name is wrong. Make sure it exactly matches the column names in your Excel file.
SyntaxError means there is a coding mistake. Ask the LLM to fix it.
Changing your Python version when needed
In Part 1, we saw that Python code runs correctly only when the versions of Python itself and its libraries are aligned. This step is for when you need to change that combination.
As you work through analyses, you may find that "this library only supports up to Python 3.10" or "that library requires Python 3.12 or later." The LLM may also suggest "please use Python 3.X" while helping you resolve an error.
To change your Python version, follow the steps below.
- Delete the old virtual environment. Using Explorer/Finder, delete the whole
.venvfolder inside your project folder. - Install the required Python version. Download it (e.g., Python 3.10) from python.org/downloads and install it. It can coexist with your existing Python installation.
- Create a new virtual environment with the specified version. In a terminal opened in your project folder, run
py -3.10 -m venv .venvon Windows, orpython3.10 -m venv .venvon Mac/Linux. - Activate the new environment and reinstall libraries. Run
.venv\Scripts\Activate.ps1to activate it, then runpip install ...to reinstall the libraries. - Select the new
.venvvia "Select Kernel" in VSCode.
Think of virtual environments as disposable work rooms. Don't hesitate to delete and recreate one. There are no important settings stored inside. As long as you keep your requirements.txt (explained in Part 4), you can easily recreate the environment.
The typical vibe coding workflow
The repeating pattern in real-world analysis looks like this.
- Extract your data structure and share it with the LLM (Step 03)
- Clarify what you want and communicate it systematically to the LLM (Steps 04 and 05)
- Download the .ipynb the LLM generates → move it to the project folder → run it
- Error occurs → paste the error into the LLM and ask for a fix (Step 07)
- It runs but the result is not what you expected → describe the difference and ask for an improvement (Step 06)
- Satisfied → move on to the next analysis (go back to item 1)
As you go through this cycle repeatedly, you develop an intuition for "this kind of prompt produces this kind of code." You don't need to memorize Python syntax. Instead, you build the skill of articulating what you want clearly.
What you can now do
- Follow the fundamental rule of not sending personal or confidential data, and use Temporary Chat
- Use a checklist to communicate your intent systematically to an LLM
- Ask for an .ipynb file directly, download it, and run it in VSCode
- Handle errors by copying the full error message and giving it to the LLM
- Request partial edits and full rewrites
- Use the two-step workflow of extracting only the structure of your data and sharing it with the LLM
- Change your Python version when needed
In Part 4, you will learn how to create a requirements.txt file that lets others reproduce the analysis environment you built here.