04 — Publications / Explainer
Measuring rice leaf area with AI
and a drone carrying an ordinary camera
We compared four ways to estimate the leaf area index (LAI)
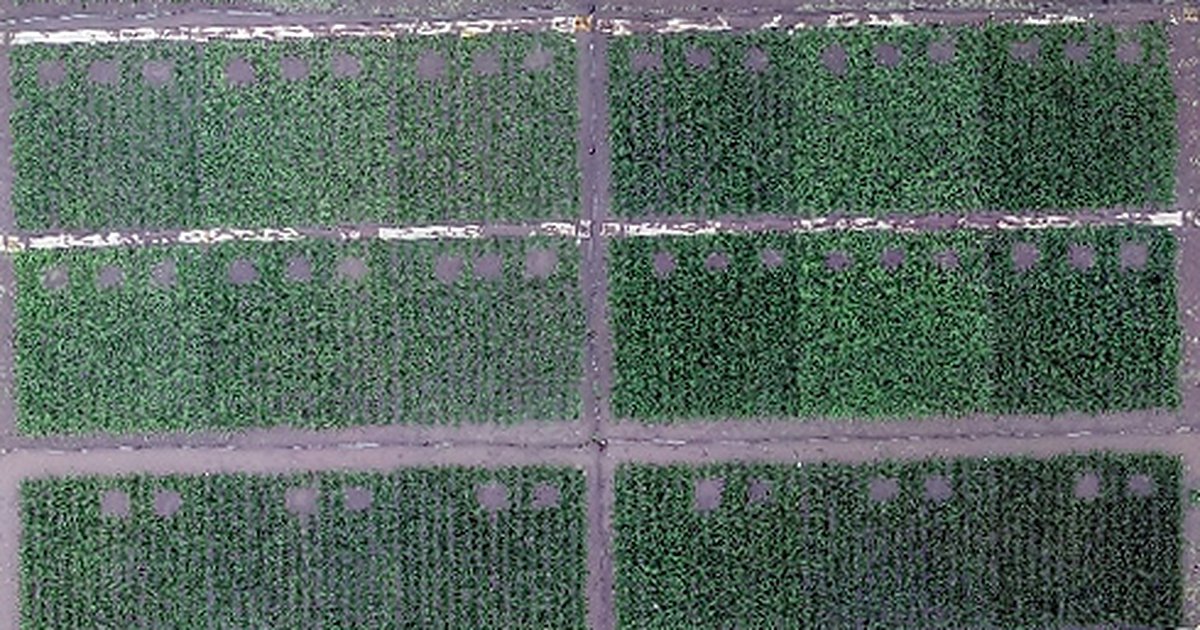
How far a rice crop spreads its leaves largely decides how much of the sunlight it captures, and knowing it helps predict the harvest. Scientists track this with the leaf area index (LAI), but measuring it properly means cutting plants and measuring their leaves. We photographed rice with an ordinary color camera on a drone and analyzed the images with deep learning, a type of AI. The estimates were nearly as accurate as those from a costly specialized camera, and more accurate than a widely used ground instrument.
Key points
- We trained a deep learning model directly on ordinary color (RGB) images from a drone to estimate the leaf area index (LAI) of rice.
- Its accuracy was close to that of a method using a costly camera that senses near-infrared light. It also outperformed methods based on simple color numbers, as well as a ground instrument.
- The data come from one paddy field in Fuchu, Tokyo, and three varieties grown in 2019. Whether the method works under other conditions still needs to be tested.
Knowing leaf area without cutting the plants
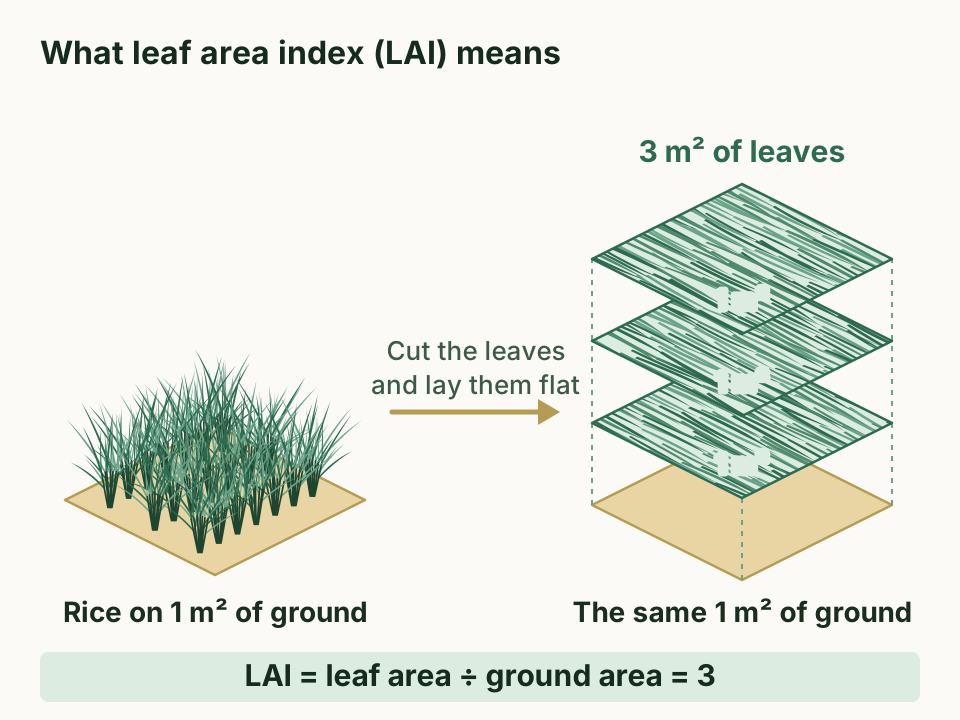
The leaf area index (LAI) shows how many times larger the green leaf area is than the ground beneath it (Figure 1). Only one side of each leaf is counted. An LAI of 3 means that 1 m² of ground holds 3 m² of leaves.
The spread of the leaves largely decides how much of the incoming sunlight a rice crop captures. That makes LAI a key piece of information for judging growth and predicting yield.
The surest way to measure LAI is to cut the plants and measure their leaf area with a machine. This takes a lot of labor and time. Only a small part of each plot can be cut, so it is also hard to get a value that represents the whole plot.
Researchers have therefore developed ways to measure LAI without cutting. A common one is the plant canopy analyzer (PCA), an instrument that measures light both above the canopy and at the base of the plants. From the two readings, it works out how much light the canopy has intercepted and estimates LAI from that.
Another approach estimates LAI from camera images. Handheld or fixed cameras, however, capture only a small part of a field. A drone can cover a wide area, and it can observe in finer detail and more often than a satellite.
Drones mainly carry two kinds of cameras. An RGB camera records red, green, and blue light, just like an ordinary digital camera. A multispectral camera also measures light the eye cannot see, such as near-infrared. Near-infrared is known to give more accurate LAI estimates, but multispectral cameras are generally more expensive.
This is where deep learning, a type of AI, comes in. It stacks many layers of calculation modeled on the nerve circuits of the brain, and it finds useful clues in images by itself. Earlier machine learning methods could use only simple numbers taken from images. Deep learning can learn from the images themselves.
How accurately can deep learning estimate rice LAI from low-cost RGB images? This had not been studied enough, so we measured that accuracy side by side with other methods.
Following three rice varieties from the air and on the ground
The field and the rice
We ran the experiment in 2019 in a paddy field at the Field Museum Honmachi of Tokyo University of Agriculture and Technology, in Fuchu, Tokyo. We grew three varieties, Akitakomachi and Koshihikari (both japonica rice) and Takanari (an indica rice). Each variety was grown with and without nitrogen fertilizer, and every combination had three plots. We transplanted the seedlings on May 22 in small clumps of three plants, called hills.
Drone flights and reference measurements
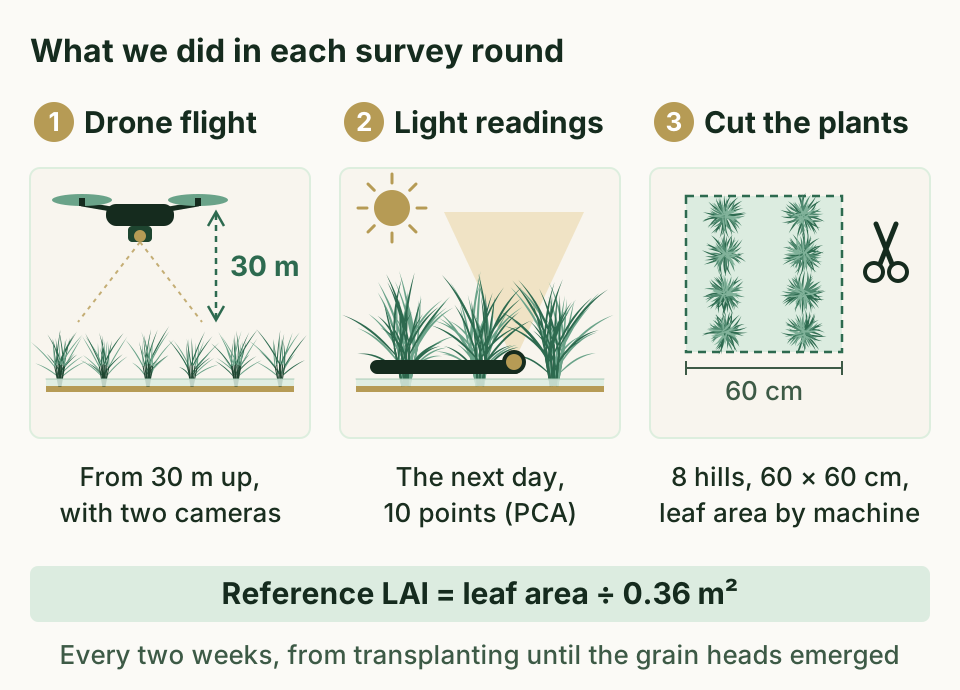
The drone, a DJI Inspire 2, carried an RGB camera and a multispectral camera. It flew above the rice at an altitude of 30 m and a speed of 3 m per second. Its photos overlapped by 80% front to back and side to side. We stitched the overlapping photos into one top-down image of the whole field. Each pixel covered 9 mm of ground for the RGB camera and 12 mm for the multispectral camera.
The day after each flight, we took PCA readings above the canopy and at 10 points under 8 hills (60 cm × 60 cm) in every plot. We then cut those 8 hills and measured their leaf area with an automatic area meter. Dividing that leaf area by the ground area of the 8 hills (0.36 m²) gave the reference LAI. We repeated this every two weeks, from transplanting until the grain heads emerged (Figure 2).
The four methods
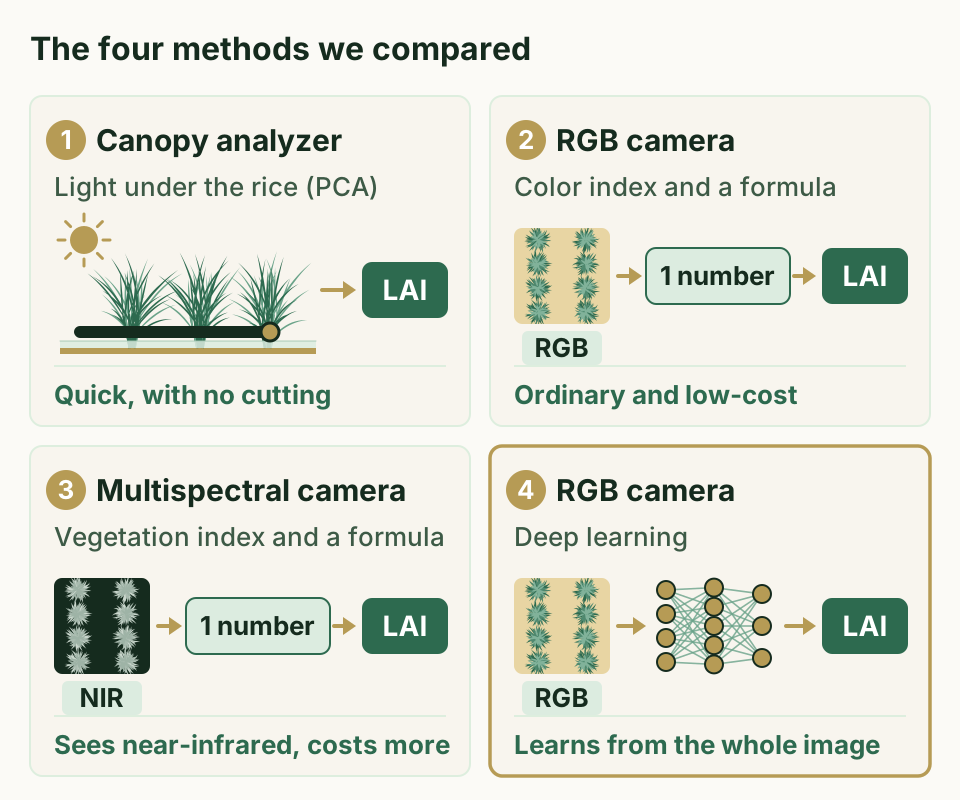
We compared how closely four methods could match the reference LAI (Figure 3).
- Canopy analyzer (PCA). The instrument compares light above the canopy with light at the base of the plants, works out how much light the canopy has intercepted, and calculates LAI from that.
- RGB camera and color indices. A color index is a number calculated from the red, green, and blue brightness of an image. We tested nine of them and fitted a formula that converts each one into LAI.
- Multispectral camera and vegetation indices. A vegetation index is calculated from how strongly near-infrared and other light is reflected. We tested twelve and fitted formulas in the same way.
- RGB camera and deep learning. We trained the AI directly on small images of the 8 hills, each 100 × 100 pixels.
For reference, we also tried four other machine learning methods, such as random forest (RF). We gave them the same data as the deep learning model.
How we trained the AI
The AI learned from images of the 8 hills in each plot (Figure 4). They cover many stages of growth, from small seedlings in June to dense leaves in late July.
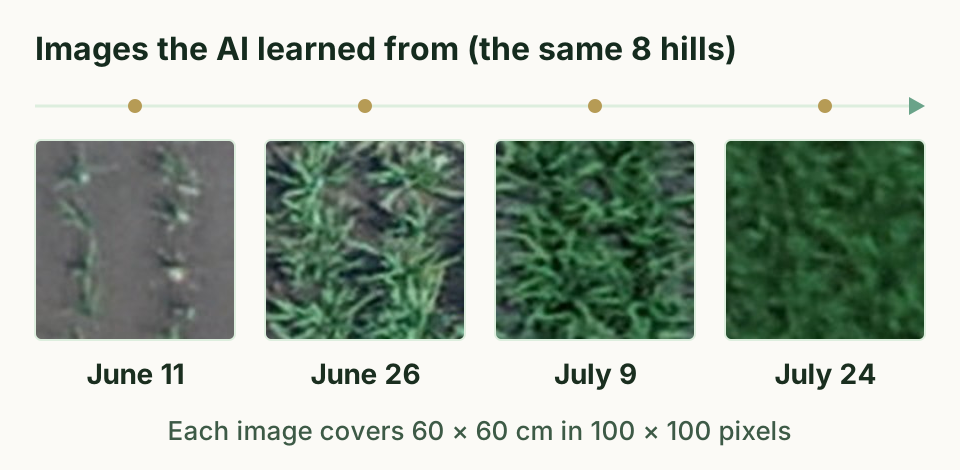
Of the three plots for each combination, we used two (48 samples) for training. We kept the third (24 samples) for testing, so we could judge the AI on data it had never seen.
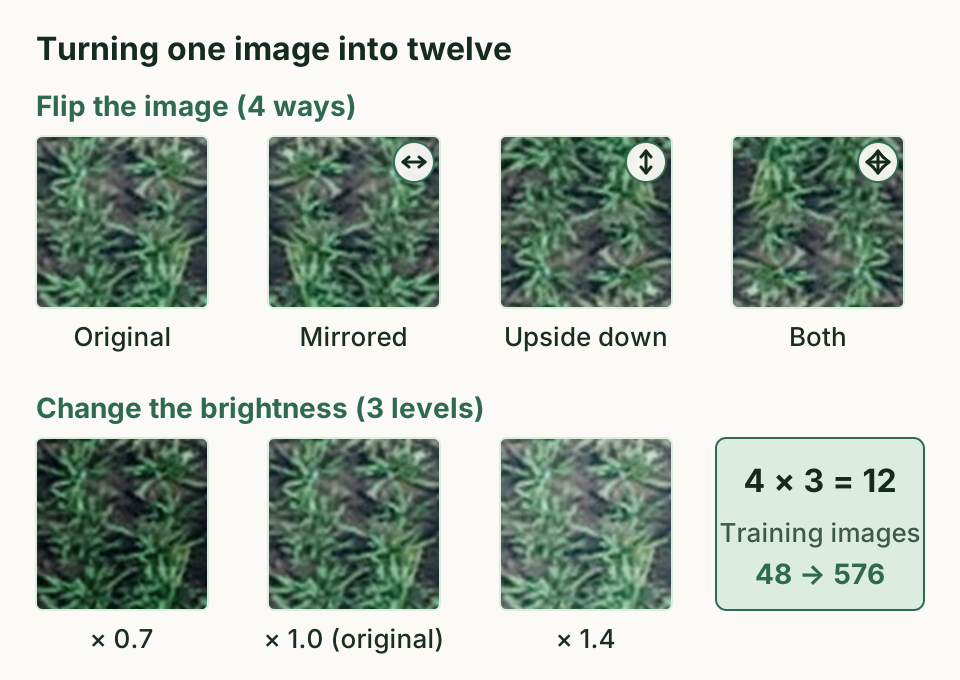
We expanded the training images twelvefold, to 576, by flipping them left to right and upside down and by changing their brightness to 0.7 and 1.4 times the original (Figure 5). For the AI itself, we adapted ResNeXt, a network design with a strong record in image recognition, to fit our data.
An ordinary camera nearly matched a costly one
The reference LAI rose as the rice grew and ranged widely, from 0.135 to 6.71.
How we judged accuracy
We used two measures. RMSE is the typical size of the gap between estimated and actual values, so closer to 0 is better. The coefficient of determination (R²) shows how well the estimates line up with the actual values, so closer to 1 is better.
Results for the four methods
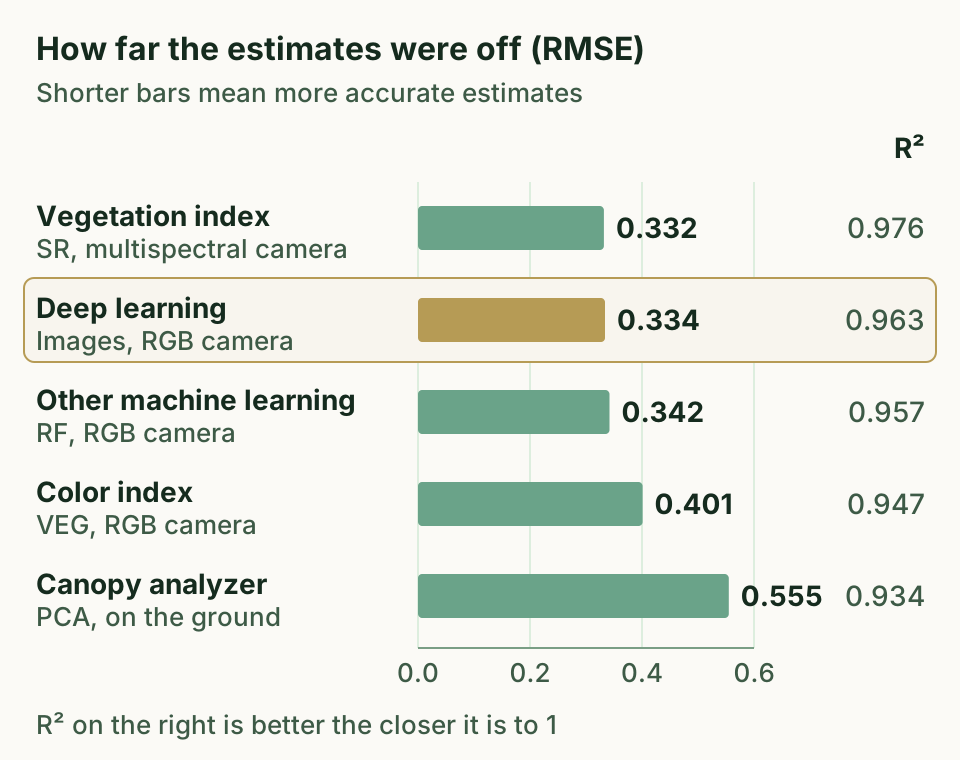
Among the vegetation indices from the multispectral camera, the best was SR, the ratio of near-infrared to red light. Its formula reached an R² of 0.976 and an RMSE of 0.332. Overall, vegetation indices were more accurate than color indices. This is likely because near-infrared reflection responds more strongly to an increase in leaf area than visible light does.
Among the color indices from the RGB camera, the best was VEG, with an R² of 0.947 and an RMSE of 0.401. Among the other machine learning methods, RF did best when it was given both the color indices and the images, with an R² of 0.957 and an RMSE of 0.342.
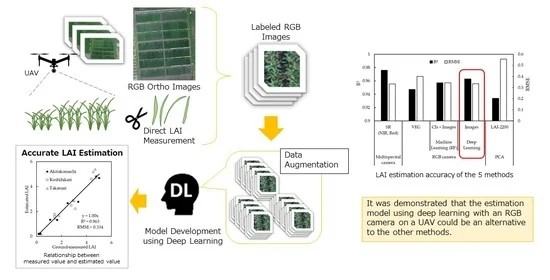
Deep learning trained on the RGB images reached an R² of 0.963 and an RMSE of 0.334. Its error was almost the same as that of SR (0.332), the best vegetation index. Paired with deep learning, an ordinary camera nearly matched the accuracy of a costly one.
The canopy analyzer (PCA) had an R² of 0.934 and an RMSE of 0.555, the largest error of the five methods in Figure 6. It also tended to read 12% lower than the actual LAI.
Showing the AI the image itself mattered
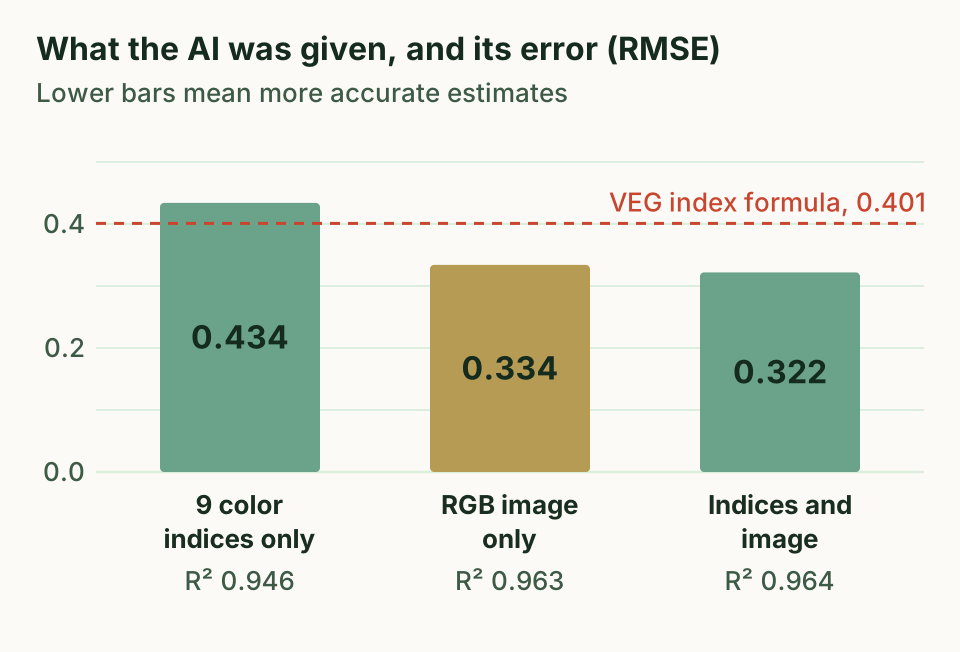
We also changed what we gave the deep learning model (Figure 7). With only the nine color indices, it reached an R² of 0.946 and an RMSE of 0.434, and it tended to underestimate LAI. That fell short of even the simple VEG formula (RMSE 0.401). With the images, the RMSE fell to 0.334. Adding the indices to the images lowered it only slightly, to 0.322.
Methods based on color indices first squeeze each image into a single number. Deep learning looks at the whole 100 × 100 pixel image and works out for itself which features matter. An image holds far more information than an index. We think the model's ability to pick up the shapes of plants and leaves in detail explains its high accuracy.
The other machine learning methods, in contrast, were less accurate with images alone than with color indices. With RF, for example, R² dropped from 0.939 to 0.851.
Why the canopy analyzer fell short
One reason for the larger error of the PCA is that its sensor also saw rice plants beyond the 8 hills we cut, even with a cap that narrows its view.
The PCA read low because it assumes that leaves are scattered randomly in space. In real rice, leaves overlap and stems grow close together, and we consider this bunching the main cause. Earlier studies have also found that the PCA underestimates rice LAI.
Even so, the PCA measures quickly without cutting and remains a useful tool, as long as users check how its readings compare with values from cut plants.
Toward watching rice leaves with an everyday drone
What this means
A drone with an RGB camera, combined with deep learning, can estimate rice LAI accurately. It could stand in for methods that rely on the PCA or a multispectral camera. Drones with RGB cameras are generally inexpensive.
If drones can measure LAI over wide areas, they could help people find uneven growth within a field or compare large numbers of breeding lines (candidate varieties).
What we do not know yet
We built the model from one paddy field, one year, and three varieties. It also covers only the period from transplanting until the grain heads emerged. We have not yet tested whether it stays as accurate in other regions, with other varieties, or under other farming practices.
We also used fine images in which each pixel covered 9 mm. How much coarser the images can be while keeping the accuracy is still an open question.
Next steps
Deep learning may adapt to a wider range of conditions as it learns from more data. We hope to collect data under different growing and imaging conditions to build a model that works in more places. More varied ways of multiplying the images, or adding multispectral images, may also raise accuracy. Combined with fixed-wing drones or high-resolution satellites, the approach might cover even wider areas.
Glossary
- Hill
- A clump of rice plants that grows from the seedlings planted together at one spot.
- Leaf area index (LAI)
- How many times larger the green leaf area (one side) is than the ground beneath it. It largely decides how much sunlight a crop captures.
- Plant canopy analyzer (PCA)
- An instrument that measures light above the canopy and at the base of the plants, and estimates LAI from how much light the canopy has intercepted. We used the LAI-2200 (LI-COR).
- RGB camera
- An ordinary digital camera that records red (R), green (G), and blue (B) light.
- Multispectral camera
- A camera that splits light by wavelength and measures how strongly each band is reflected. Ours measured blue, green, red, red edge (between red and near-infrared), and near-infrared.
- Near-infrared light
- Light with a slightly longer wavelength than red light. The human eye cannot see it.
- Color index and vegetation index
- A single number that sums up the state of plants from image colors or reflected light. Here, color indices come from the RGB camera, and vegetation indices also use near-infrared light.
- Deep learning
- A kind of machine learning that stacks many layers of calculation modeled on the nerve circuits of the brain. It finds useful features in images on its own.
- Coefficient of determination (R²)
- A number that shows how well estimates line up with actual values. The closer it is to 1, the better the match.
- RMSE
- A measure of how far estimates typically miss the actual values. It uses the same unit as LAI, and closer to 0 is better.
About the paper
Tomoaki Yamaguchi, Yukie Tanaka, Yuto Imachi, Megumi Yamashita & Keisuke Katsura (2021). Feasibility of Combining Deep Learning and RGB Images Obtained by Unmanned Aerial Vehicle for Leaf Area Index Estimation in Rice. Remote Sensing, 13(1), 84. https://doi.org/10.3390/rs13010084
This open access paper is free for anyone to read. It is published under the Creative Commons Attribution 4.0 International license (CC BY 4.0), and some figures on this page are adapted from it.