04 — Publications / Explainer
Estimating rice biomass by first reading leaf area, height, and tillers
A new neural network, tested on 24 rice varieties of very different shapes
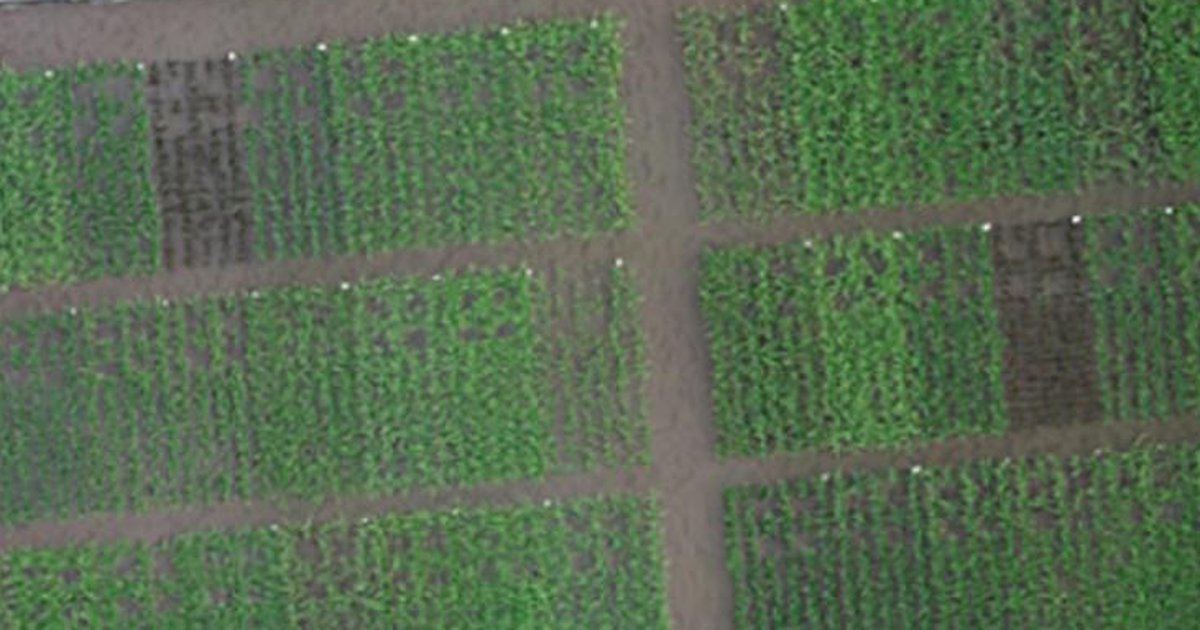
The growth of a rice crop is usually measured as biomass, the dry weight of its leaves and stems, and measuring it means cutting plants. We study how to estimate it from images taken above the field instead. Here we built a neural network, MTOC-NN, that first estimates leaf area, plant length, and the number of tillers (stems), then uses them to estimate biomass. Across 24 varieties of very different shapes, it had the smallest error of the nine methods we compared. It also showed that the traits behind biomass differ between varieties.
Key points
- Instead of going straight from images to biomass, the model adds a middle step. It first estimates leaf area index (LAI), plant length, and tiller number, then uses them to estimate leaf and stem biomass.
- Across 24 varieties of very different shapes, it had the smallest error (RMSE) of the nine methods we compared. Random forest, in second place, was very close.
- The traits that mattered most differed by variety. In tall varieties, plant length tended to matter most. In short varieties with many tillers, leaf area and tiller number did.
Knowing how much rice has grown, without cutting it
Knowing how much a rice crop has grown is key to judging its condition and predicting grain yield. It also shows whether a change in farming practice has worked.
A common measure is biomass, the amount of plant material. Here it means the dry weight of the leaves and stems. Measuring it means cutting plants in the field, which takes a lot of time and effort.
Researchers have therefore turned to images taken from above. Machine learning, which lets a computer learn from many examples, links numbers from the images, such as color and height, to biomass.
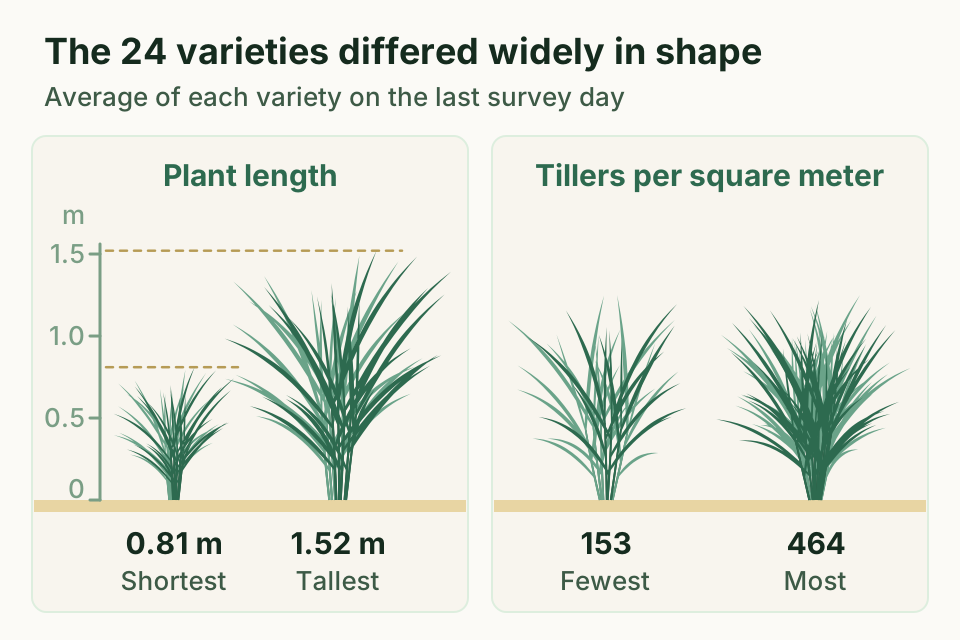
Two problems remained. The first is the wide range of plant shapes. Rice varieties differ a lot in height and in the number of tillers, the stems a plant sends up from its base (Figure 1). Yet earlier models were built from data on only a few varieties and a few fertilizer levels.
The second is that the results were hard to interpret. Many accurate machine learning models are black boxes whose inner workings are hard to follow. Researchers could check which image numbers mattered, but not link the results to plant traits such as height or tiller number.
Growing 24 varieties and pairing images with field measurements
Twenty-four varieties over two years
We ran the experiment in a paddy field at Tokyo University of Agriculture and Technology in Fuchu, Tokyo, in 2020 and 2021.
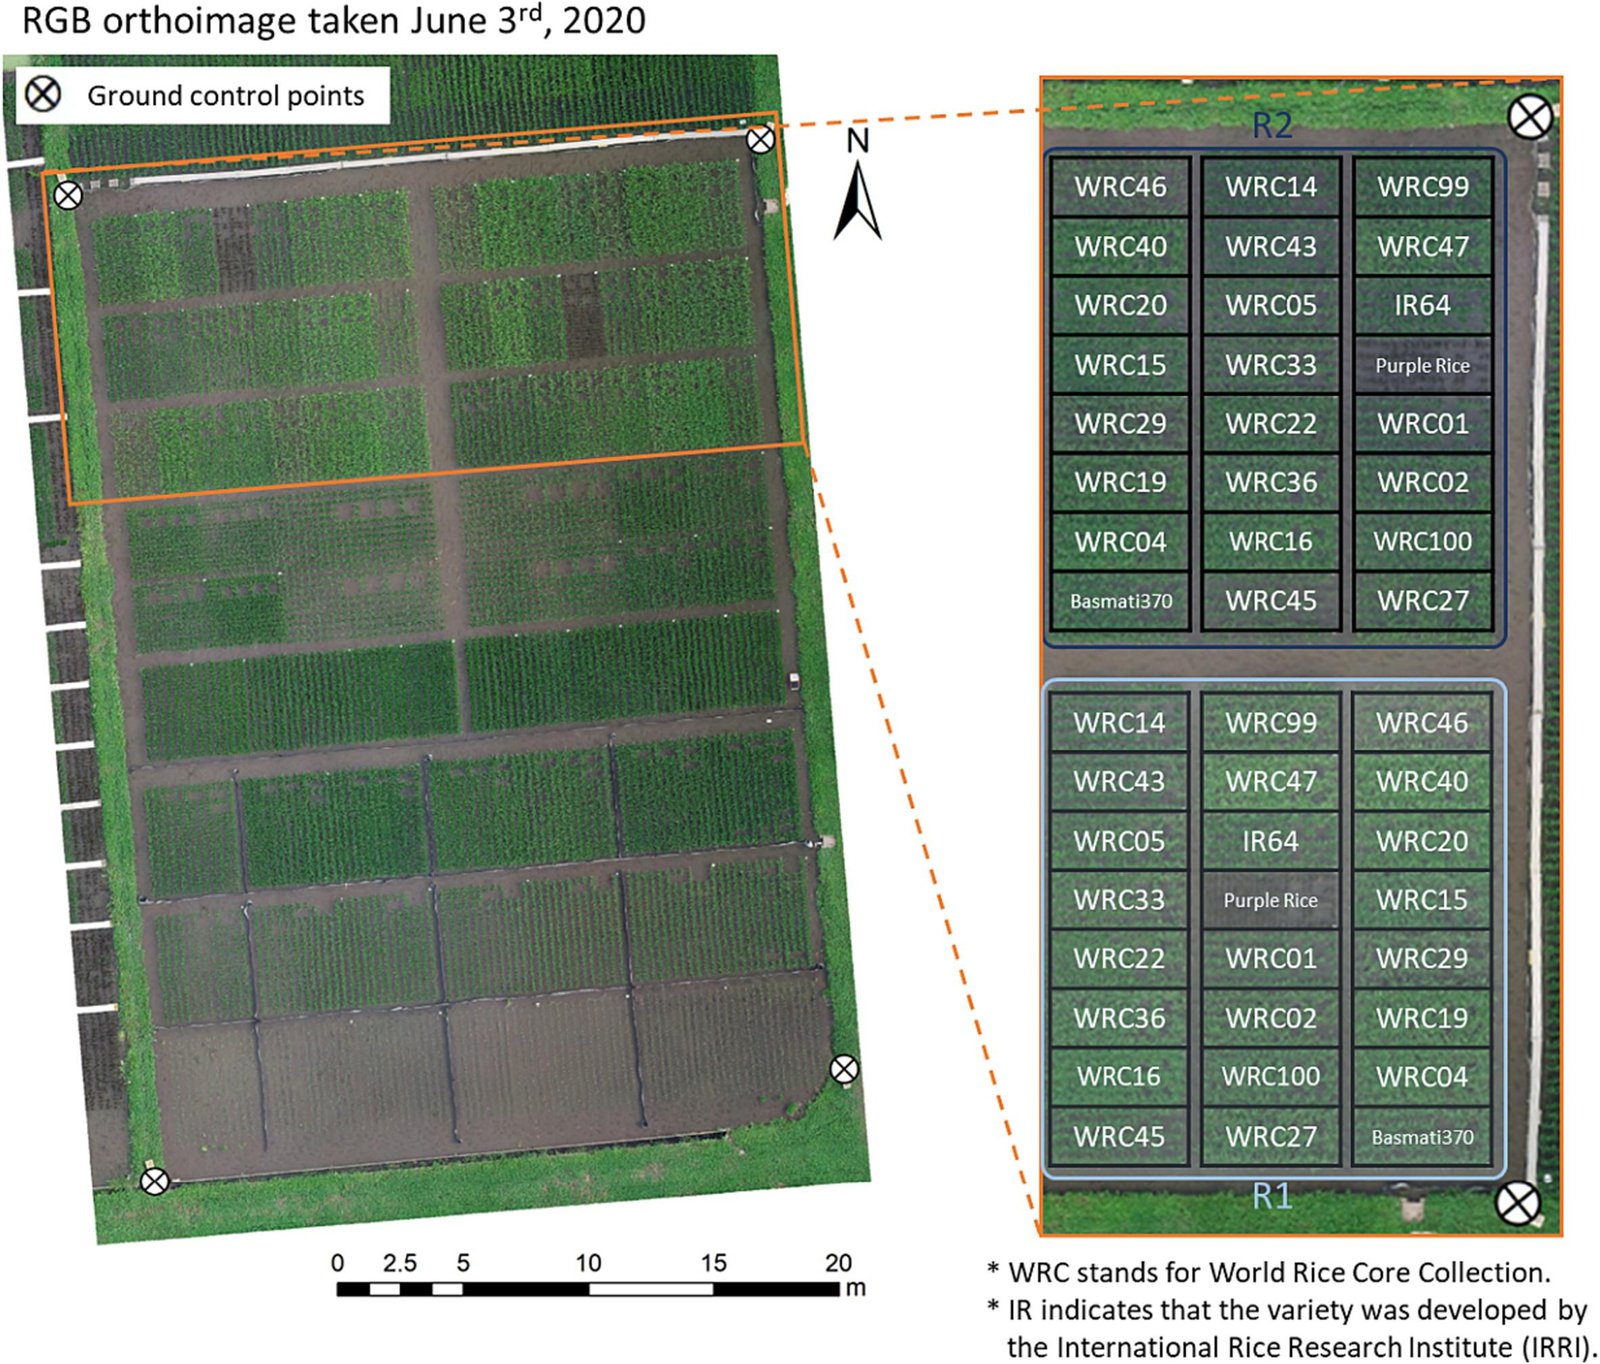
We grew 24 varieties. Twenty-one came from the World Rice Core Collection, a set of 69 varieties covering more than 90% of the genetic diversity of rice. The other three were IR64, the most widely grown rice variety in the world, the aromatic Basmati 370, and a purple rice that is purple all over.
Each variety was planted in two plots (Figure 2). From transplanting until just before heading, when the grain heads begin to emerge, we surveyed the field every week.
Numbers from images, and measurements from cut plants
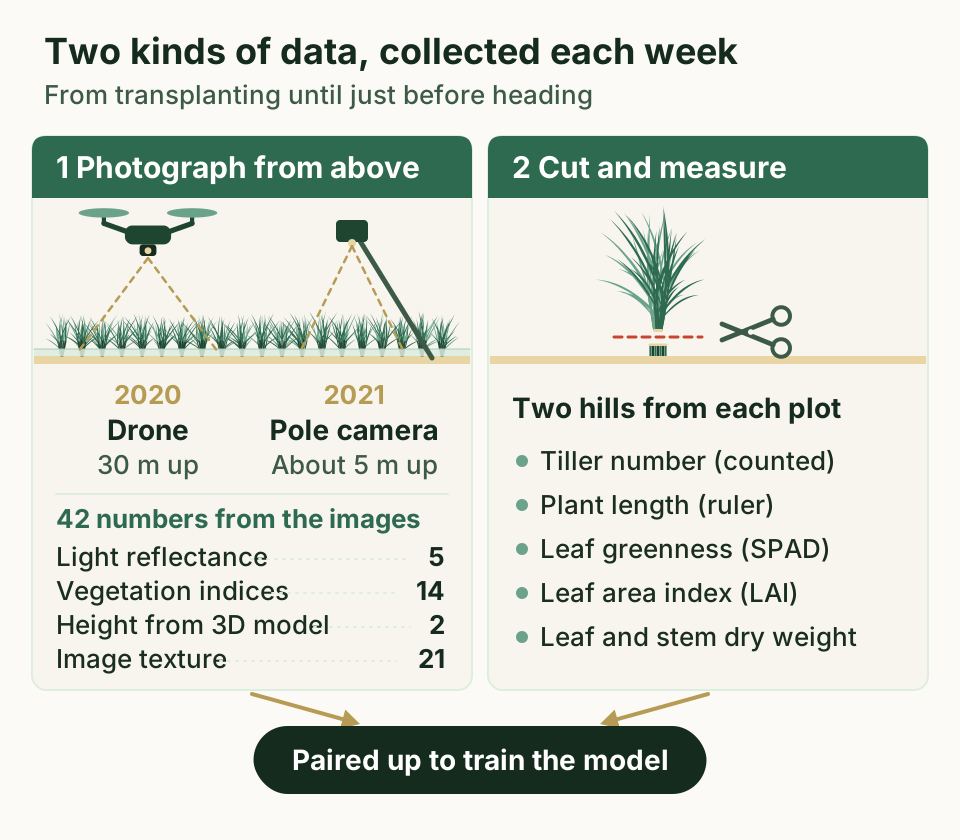
On each survey day we first took photos from above. In 2020 we used a drone flying 30 m up. In 2021 we fixed the camera to the end of a 7 m pole and took photos from about 5 m up.
We used a standard color camera and a multispectral camera, which also records near-infrared light that the eye cannot see. From the images we took 42 numbers (Figure 3). They include how strongly the plants reflect light in each band, vegetation indices that combine these values to show how leafy the crop is, canopy height from a 3D model, and the fine texture of the image.
We then cut two hills from each plot. A hill is the clump of rice that grows from one planting spot. We counted the tillers by hand, stretched the leaves upward to measure plant length with a ruler, and read leaf greenness with a SPAD meter.
We also measured the leaf area and divided it by the ground area each hill occupies, which gives the leaf area index (LAI). Leaves and stems were dried separately at 80 °C for at least 72 hours and weighed. In all, we collected 1,600 data points.
First the traits, then the biomass
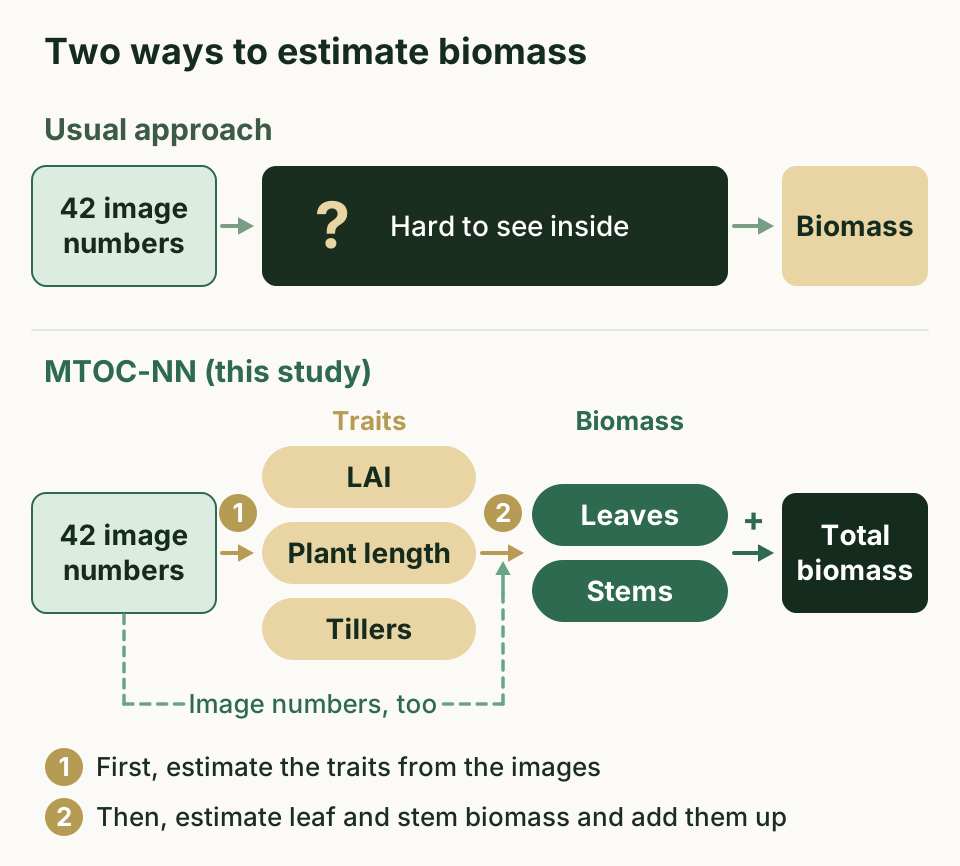
A typical model goes from image numbers straight to biomass. We added a step in between (Figure 4). The model first estimates LAI, plant length, and tiller number from the image numbers. It then uses those estimates, together with the image numbers, to estimate leaf and stem biomass, and adds the two to give total biomass.
Biomass is known to be linked to many plant traits, such as height and tiller number. We expected that estimating such traits first would make biomass easier to estimate, even when varieties of very different shapes are mixed together.
The design combines two ideas. One is multitask learning, which trains a model on several outputs at once. The other is a regressor chain, which feeds the result of one estimate into the next. As far as we know, no earlier crop study based on images taken from above had used a regressor chain.
The design has another benefit. It lets us measure how much each trait contributed to the biomass estimate. Leaf greenness (SPAD) was also a candidate for the middle step, and we compared which combination of traits worked best.
Comparing nine methods
We compared MTOC-NN with six common machine learning methods, such as multiple linear regression and random forest, and with a neural network that estimates biomass alone. A neural network is a computing system loosely modeled on the brain's nerve cells. We also built MTO-NN, which estimates the traits and biomass all at once but does not feed the traits into a second step. That makes nine methods in all.
We set aside the R1 data from 2020 for testing and trained the models on the rest. We compared accuracy mainly by RMSE, the typical gap between estimated and measured values. Smaller is better.
The smallest error, and differences between varieties
The smallest error of the nine methods
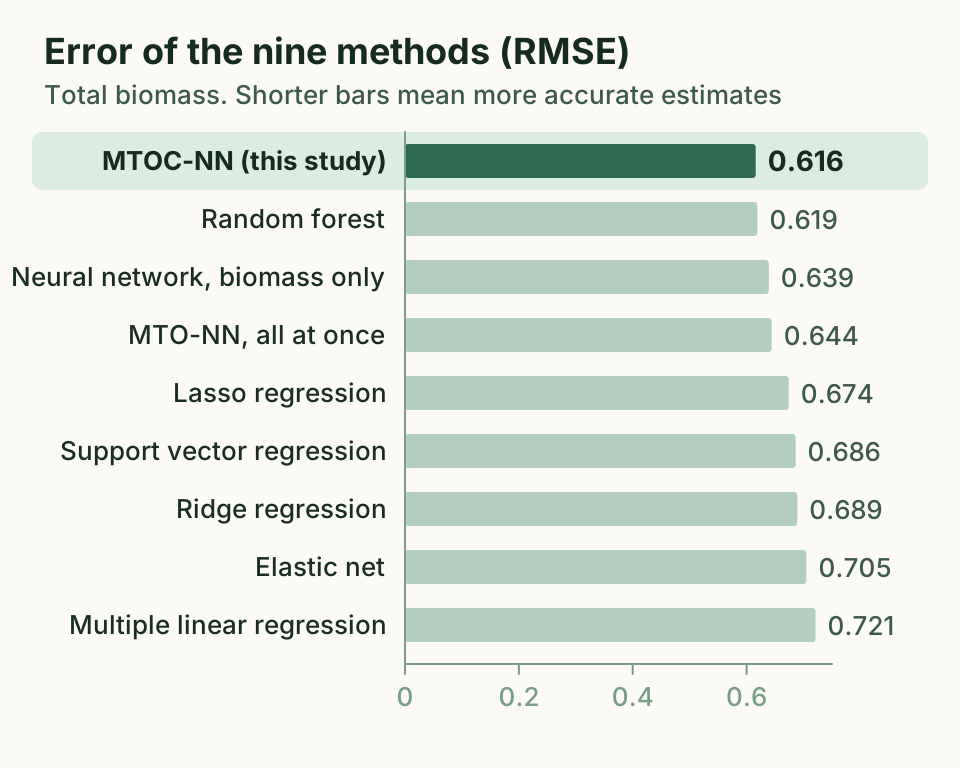
For total biomass, MTOC-NN had an RMSE of 0.616, the smallest of the nine methods (Figure 5). Its relative error (RRMSE), the RMSE divided by the average measured value, was also the smallest, at 0.243.
The margin was small, though. Random forest came second at 0.619. On two other measures, mean absolute error (MAE) and the coefficient of determination (R²), MTOC-NN ranked second.
MTO-NN, which estimates everything at once without the chain, scored 0.644, slightly behind random forest and the biomass-only neural network. The gain seems to come from combining multitask learning with the chain.
Choosing the right traits for the middle step
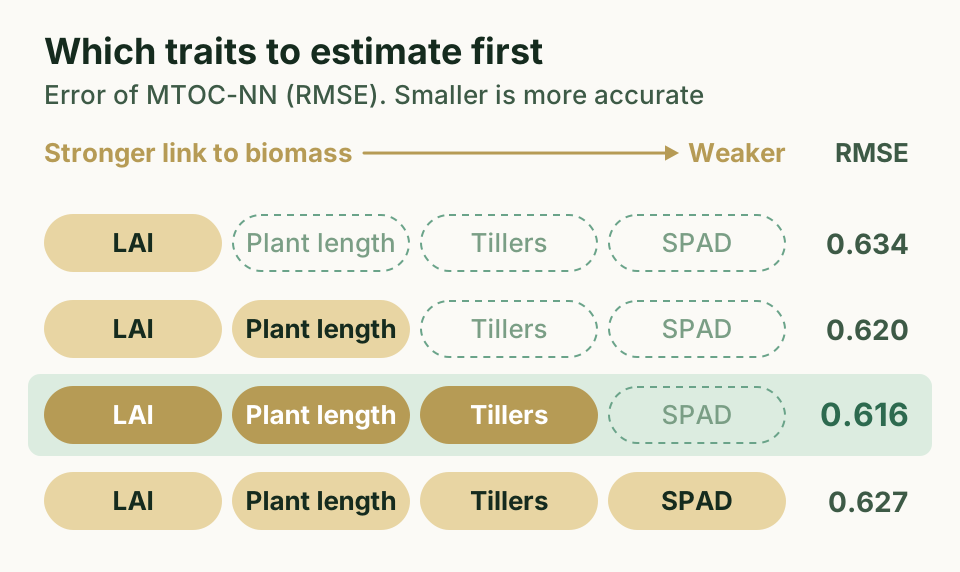
Ranked by how closely they track biomass, the four candidate traits were LAI, plant length, tiller number, and SPAD, in that order. We removed them one at a time, starting with the weakest, and compared the results (Figure 6).
The best result came from using LAI, plant length, and tiller number. Adding SPAD made the error larger, not smaller.
SPAD had a weak link to biomass, and the model also estimated it from the images less accurately than the other traits. Its errors were probably carried into the biomass estimate. So it seems important to choose traits that are closely linked to biomass and that can be estimated well from the images. The analyses below use the model with these three traits.
Leaves and stems relied on different traits
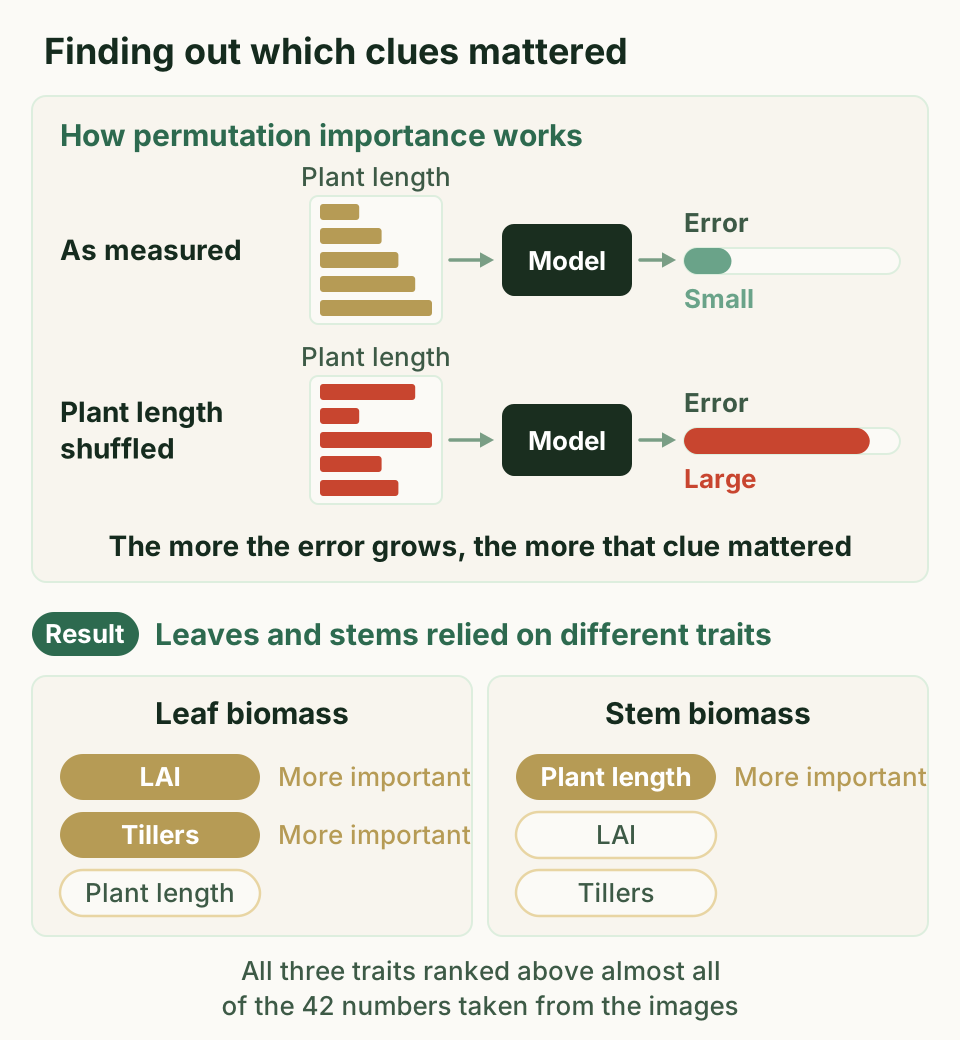
To see which clues mattered, we used permutation importance (Figure 7). It shuffles the values of one clue across the data and runs the estimate again. The bigger the drop in accuracy, the more that clue mattered.
LAI, plant length, and tiller number ranked above almost all of the 42 image numbers, and for leaf biomass they ranked above every one. The traits estimated in the middle step did much of the work.
Among the three, LAI and tiller number mattered more for leaf biomass, while plant length mattered more for stem biomass. LAI and tiller number relate to how leaves grow and spread, and plant length relates to upward growth.
Tall varieties and varieties with many tillers build biomass differently
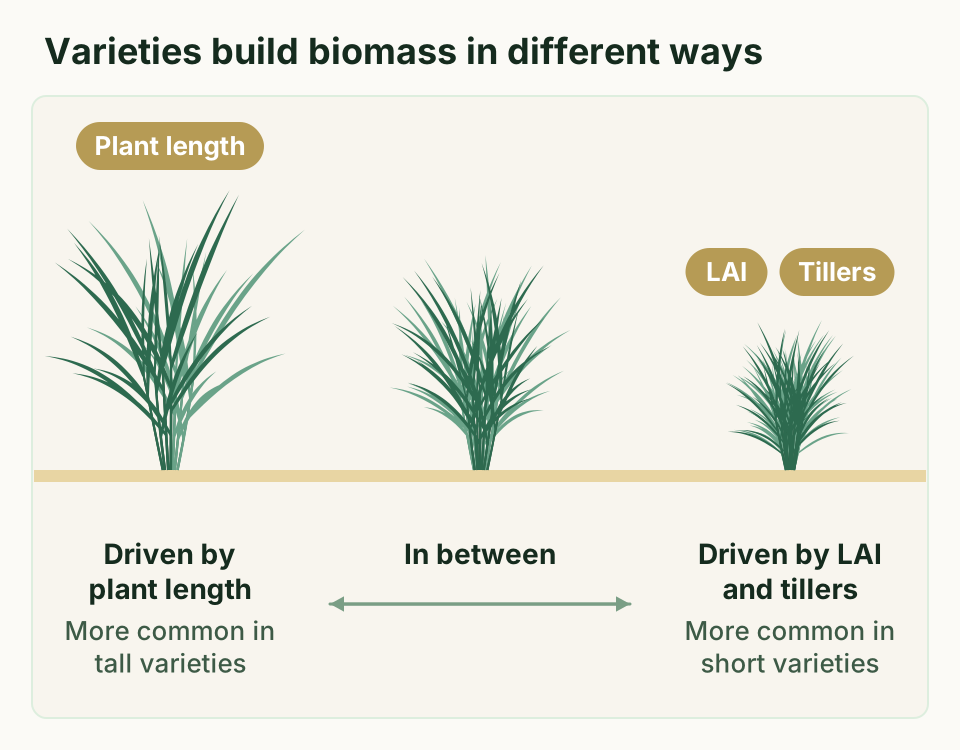
When we repeated the analysis for each variety, the share of importance among the three traits varied widely. The importance of LAI and of tiller number tended to rise and fall together, while that of plant length moved the opposite way.
This points to two ways of building biomass, one driven by plant length and one driven by LAI and tiller number. Some varieties fell in between (Figure 8). Taller varieties tended toward the first, and shorter varieties toward the second.
For leaf biomass, for example, a variety's plant length had a correlation coefficient of 0.572 with the importance of plant length and −0.597 with the importance of LAI. This coefficient runs from −1 to 1. It nears 1 when two values rise together and −1 when one rises as the other falls.
Shorter rice plants are generally known to produce more tillers, and in this study too, plant length and tiller number were negatively correlated. This link may lie behind the two ways of building biomass.
How this can help crop research, and what remains
What we learned
MTOC-NN estimated rice biomass accurately even with varieties of very different shapes mixed together. It can also show, in numbers, how the traits behind biomass differ between varieties. Earlier studies ranked only image numbers, so they offered little or no insight from a crop science point of view.
Where it could help
Crop research often means measuring many traits by hand for many varieties and breeding lines. MTOC-NN could help researchers see how each variety builds biomass without laborious cutting surveys. We hope it will speed up and deepen the search for the plant traits that matter most.
What we do not know yet
Building MTOC-NN requires measuring LAI, plant length, and tiller number as well as biomass, so collecting data takes more time and effort than for earlier models. Handling data in which some traits are missing is another open question.
Our data came from a single paddy field in Fuchu, Tokyo, in 2020 and 2021. They cover the period from transplanting to just before heading, and the test data came from the same field. We have not yet checked whether the model works as well in other regions, under other growing conditions, or after heading.
To keep the model simple, we also did not consider the order in which the traits are estimated.
Next steps
To make up for missing data, we plan to try pseudo-labeling, which uses the model's own estimates as provisional answers for training.
Grain yield could also become the final target, with yield-related traits such as leaf angle and light interception added to the middle step. Choosing the order of the chain with care may make the model both more accurate and easier to interpret.
A physics-based model such as PROSAIL, which calculates plant traits from reflected light, could also be built into the first step. This could add traits that we can interpret, with no need for more training data.
Glossary
- Biomass
- The amount of plant material. In this study it is the dry weight of the leaves and stems, in metric tons per hectare.
- Tiller
- A stem that a rice plant sends up from its base. Tiller number is the count of these stems, here given per square meter.
- Leaf area index (LAI)
- The total leaf area (one side) divided by the ground area the plant occupies. It shows how densely the leaves cover the ground.
- SPAD value
- A measure of how green a leaf is, read with a handheld meter that clips onto the leaf.
- Neural network
- A computing system loosely modeled on the brain's nerve cells. It learns the link between inputs and answers from many examples.
- Regressor chain
- A method that feeds the result of one estimate into the next. The C in MTOC-NN stands for chained.
- Permutation importance
- A way to measure how much an input matters. The input is shuffled across the data, and the drop in accuracy shows its importance.
- RMSE (root mean squared error)
- A measure of the typical gap between estimates and measurements. The gaps are squared and averaged, and then the square root is taken. Smaller is better.
- Correlation coefficient
- A number from −1 to 1 that shows how closely two values move together. It is positive when both rise together and negative when one falls as the other rises.
About the paper
Tomoaki Yamaguchi & Keisuke Katsura (2024). A novel neural network model to achieve generality for diverse morphologies and crop science interpretability in rice biomass estimation. Computers and Electronics in Agriculture, 218, 108653. https://doi.org/10.1016/j.compag.2024.108653
This is an open access paper that anyone can read for free. It is published under the CC BY 4.0 license, which also covers the figures from the paper used on this page.