04 — Publications / Explainer
Fifty years of rice records show
each season has its own keys to yield
We used explainable AI to read a long-running rice experiment in the Philippines
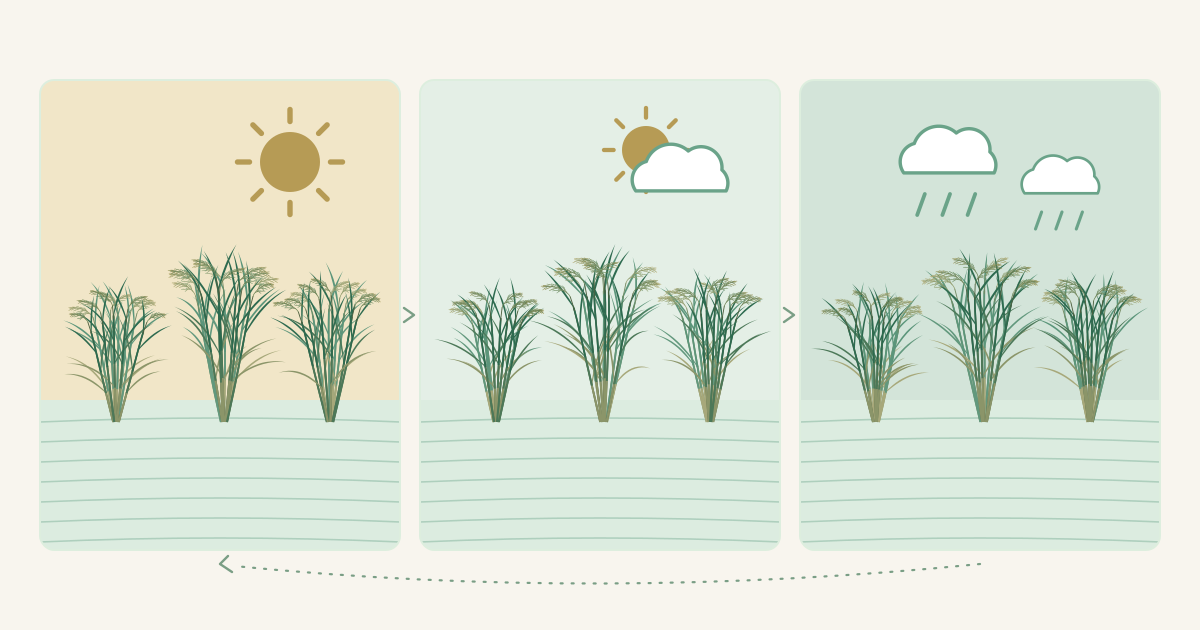
At the International Rice Research Institute (IRRI) in the Philippines, rice has been grown three times a year in the same field since 1968. We studied about fifty years of its yield and weather records with machine learning and explainable AI. Nitrogen fertilizer and sunlight supported yields in every season, while the effects of temperature, disease, and variety age changed with the season. The results show that each season needs its own management plan and that varieties should be replaced more often.
Key points
- We used machine learning on the records of the world's longest-running trial with three rice crops a year in one field, covering 1968 to 2017.
- Nitrogen fertilizer, sunlight, and regular variety replacement supported yields in every season. The effect of temperature differed by season, with cooler conditions helping in the dry season and warmer early growth helping in the early wet season.
- In the late wet season, nitrogen worked less well the longer a variety stayed in use. Replacing varieties helps keep yields up.
Why keeping yields high for decades is hard
More than 75% of Asia's rice comes from irrigated paddies, which do not depend on rain alone. In Asia, about 22 million hectares of such fields grow two or three rice crops every year.
Rice is the only major cereal that can be grown in the same place for very long periods. Flooding the soil helps supply nutrients, maintains soil organic matter, and holds back weeds and pests.
Keeping yields high for decades is not easy, though, because the climate changes and so do the pressures from pests and diseases. Even at IRRI's Long-Term Continuous Cropping Experiment, the world's longest-running trial with three rice crops a year, yields kept falling until about 1990.
Suggested causes included a nitrogen supply that did not match the crop's needs, pests and diseases, and too little sunlight in some seasons. In the early 1990s, changes to fertilizer use, longer fallow periods (breaks between crops when the field is left unplanted), and better disease control brought yields back for a while.
Still, no study had systematically examined how climate, varieties, and fertilizer management worked together over the decades. The factors are many and affect one another, so ordinary analyses struggle to separate them. We therefore turned to machine learning, which learns relationships directly from the data.
The field grows three crops a year (Figure 1). The dry season gets the most sunlight, and the late wet season gets the least.
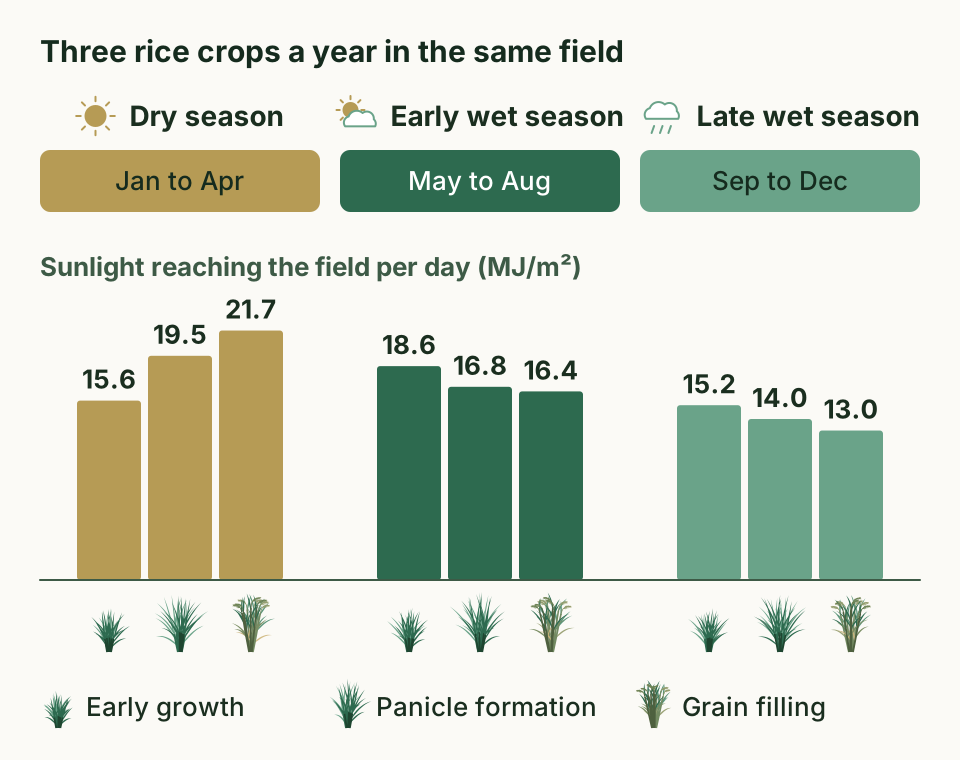
Reading fifty years of yield and weather records with machine learning
How the experiment works
The field lies on IRRI's research farm in Los Baños, the Philippines. It is divided into four plots that receive different amounts of nitrogen fertilizer, and each plot grows three to six varieties (Figure 2). F1 gets no nitrogen, and F2 to F4 get increasing amounts.
Over time, the varieties were replaced with the best high-yielding, pest- and disease-resistant varieties of the day. Yield is measured by harvesting 10 m² of each plot when the crop is mature. Because the early records fluctuated abnormally, we used data from 1971 onward.
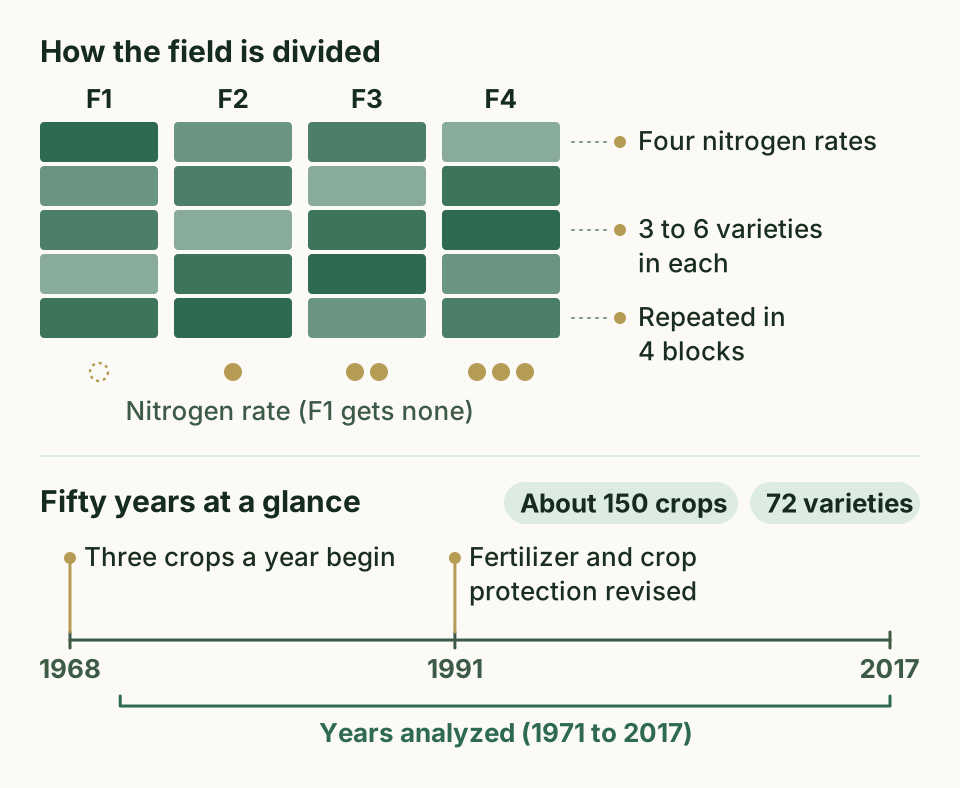
Gathering the factors that might matter
For weather, we used JRA-55, a reanalysis from the Japan Meteorological Agency that rebuilds past weather without gaps. We adjusted it to match the observations at IRRI.
We split each crop into three growth stages. First comes early growth, when the plant puts out leaves and tillers (side shoots), then panicle formation, when the grain head takes shape, and finally grain filling. For each stage, we calculated the daily maximum and minimum temperatures and the sunlight.
We also covered five diseases, namely leaf blast, brown spot, bacterial blight, sheath blight, and tungro. For each one, we used the weather to score how favorable conditions were for the disease. These risk scores are not counts of actual infections.
In addition, we included the nitrogen rate, the variety, and the age of the variety, which is the number of years since it entered the experiment. We also included the field's cropping history, such as the number of crops grown so far, the length of the fallow period, and the yield of the previous crop.
Predicting yield with machine learning
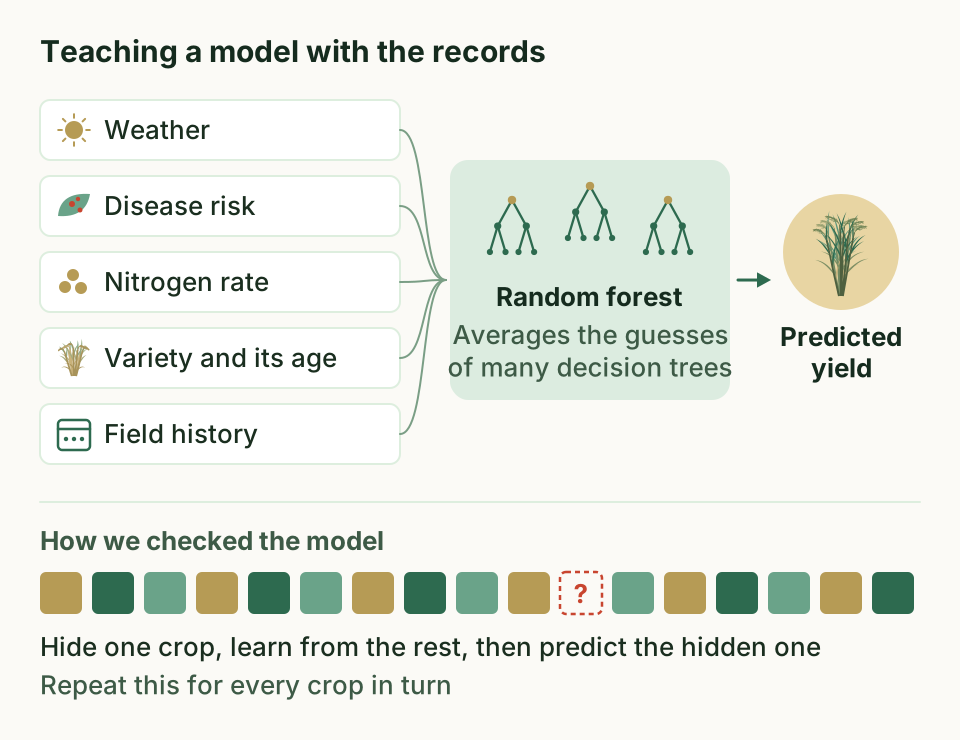
From these factors, we built models that predict yield using a machine learning method called random forest (Figure 3). It grows many decision trees, each of which reaches an answer through a series of yes-or-no splits, and averages their predictions.
We built one model for all three seasons together and one for each season. To check the models, we hid one crop's data at a time, trained on the rest, predicted the hidden crop, and compared the prediction with the real yield.
Opening up the predictions with explainable AI
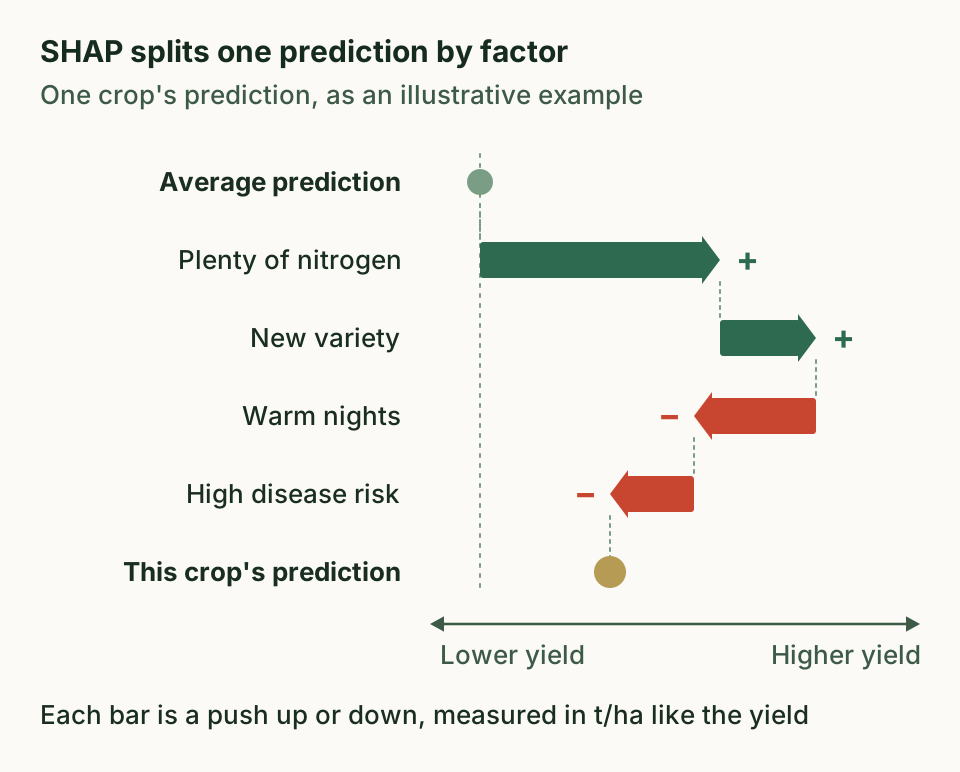
A good prediction alone does not tell us why a yield was high or low, so we used SHAP, an explainable AI (XAI) method. For each prediction, SHAP shows how much each factor pushed the yield up or down (Figure 4). The pushes are measured in metric tons per hectare (t/ha), like the yield, so they are easy to compare.
Gathering these values over all crops shows which factors mattered most, and how pairs of factors change each other's effect.
The keys to yield differed by season
Highest yields in the dry season, lowest in the late wet season
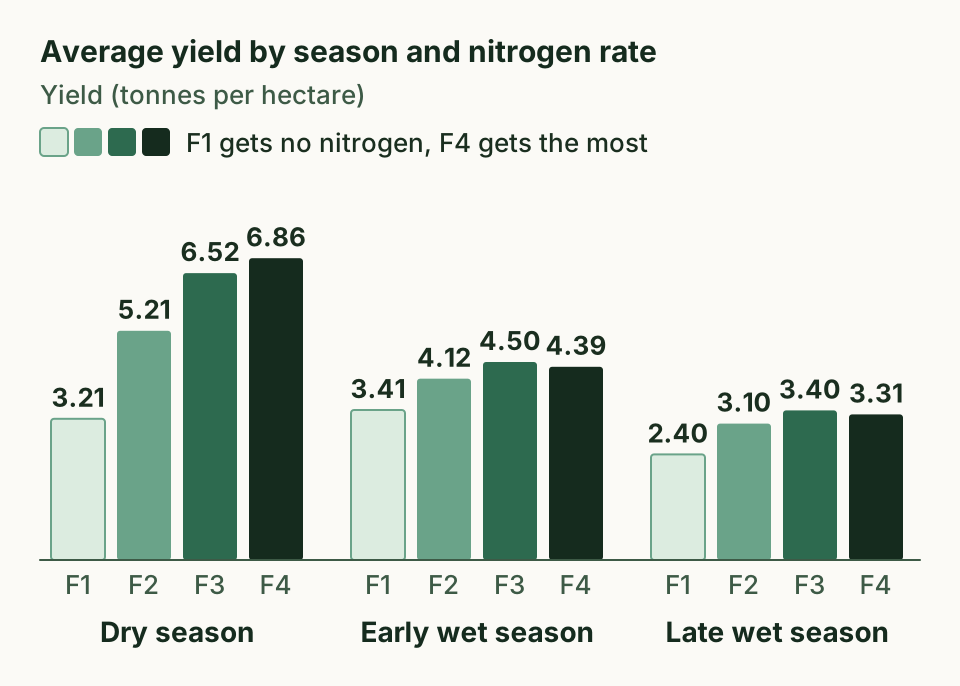
Average yields were highest in the dry season, reaching 6.86 tons per hectare in F4, the plot with the most nitrogen (Figure 5). In both wet seasons, F3 yielded more than F4, and in the late wet season the average stayed at or below 3.40 tons per hectare in every plot.
Year-to-year swings differed too. More nitrogen made dry-season yields steadier but tended to make wet-season yields slightly less steady. The sustainable yield index, which combines how high and how steady yields are, was highest in the dry season (0.23 to 0.55) and lowest in the late wet season (0.19 to 0.26).
In the plots that received nitrogen, yields stepped up in 1990 or 1992. The timing matches the introduction of fallow periods and changes in fertilizer rates. After that, there was no clear upward or downward trend, except for a decline in F4 in the late wet season.
Trend lines like these cannot tell us whether the weather, the varieties, or the fertilizer made the difference. Machine learning helps sort this out.
Nitrogen, sunlight, and new varieties helped in every season
In the model for all seasons together, the main factors were the nitrogen rate and variety replacement. The weather factors that mattered were sunlight during panicle formation and grain filling, the maximum temperature during grain filling, and the minimum temperature during early growth.
Sunlight and higher maximum temperatures pushed yields up, while a warmer minimum temperature in early growth pushed them down. The models for each season, however, showed that temperature worked differently from season to season.
Temperature worked in opposite directions
In the dry season, yields tended to be higher when the minimum temperature was lower during panicle formation and grain filling. A lower maximum temperature during panicle formation also helped.
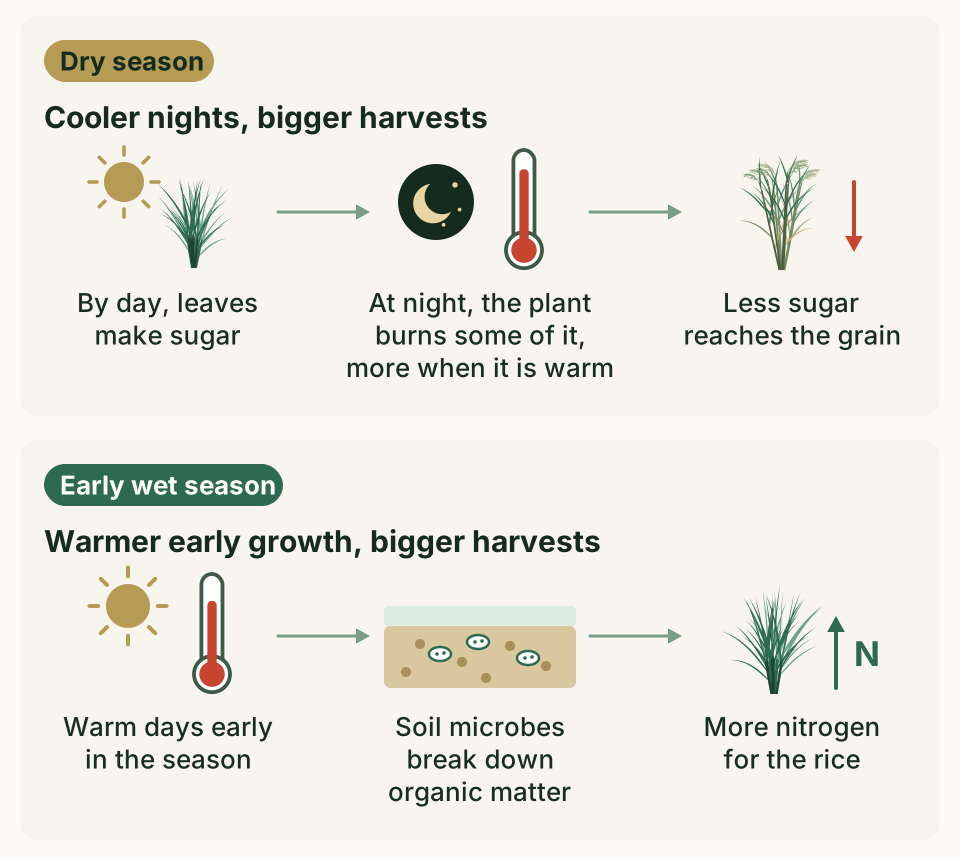
The minimum temperature is roughly the night temperature. On warm nights, the plant uses more energy for respiration, so less is left for the grain. This is the most likely explanation (Figure 6, top).
Minimum temperatures kept rising until the late 1980s, while dry-season yields fell, so this rise may have been one cause of the earlier decline. The recovery also coincided with changes in management, so better management and a more favorable climate probably worked together.
In the early wet season, the pattern was reversed. Yields tended to be higher when the days were warmer during early growth. In flooded paddy soil, microbes release nitrogen from organic matter much faster as the temperature rises from 20 to 35 °C. Warmer early growth probably gave the crop more soil nitrogen (Figure 6, bottom).
In the dry season, disease risk changed how well nitrogen worked
In the dry season, a low risk of tungro, a viral disease of rice, also went with higher and steadier yields. The strongest link the model found was between nitrogen fertilizer and the tungro risk during panicle formation.
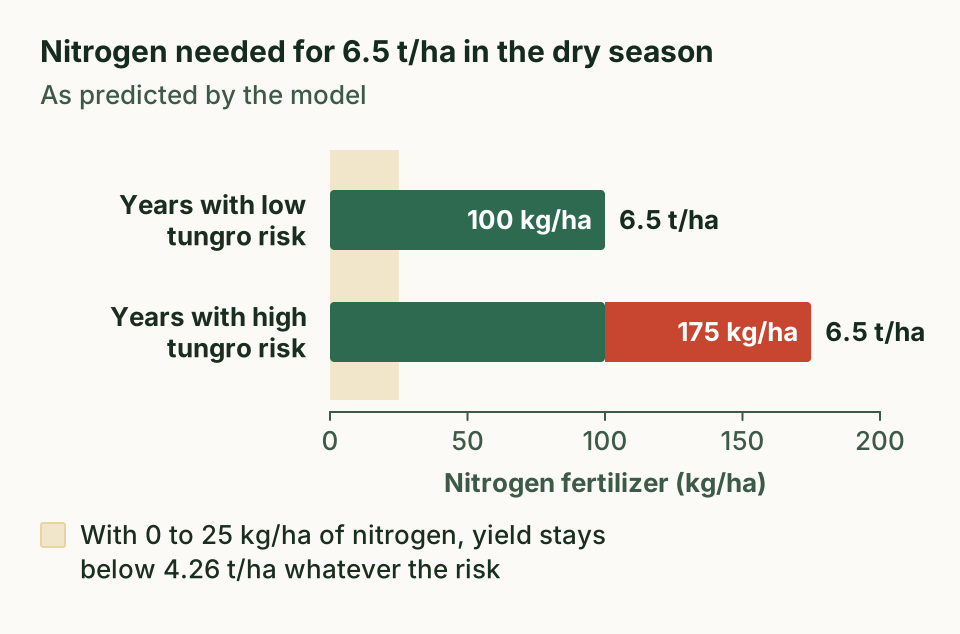
According to the model, with only 0 to 25 kg of nitrogen per hectare, yields stay below 4.26 tons per hectare whatever the risk. With low tungro risk, 100 kg of nitrogen per hectare is enough for 6.5 tons per hectare, but with high risk the same yield takes 175 kg (Figure 7). When the disease is likely, fertilizer pays off less.
In the early wet season, decades of cropping helped nitrogen work
In the early wet season, yields tended to rise with the number of crops the field had grown so far. The strongest link was between this crop count and nitrogen fertilizer. In the model, nitrogen worked better once the field had grown more than 80 crops, or about 27 years.
Earlier studies have reported that soil nitrogen builds up as a field is cropped again and again. Our results also suggest that less nitrogen fertilizer might be needed in wet seasons when early growth is warm and the soil supplies plenty of nitrogen.
In the late wet season, the age of the variety mattered
The late wet season gets the least sunlight and gives the lowest yields. Here, yields tended to be higher when the risks of bacterial blight and sheath blight were low.
The longer the same variety stayed in use, the less it responded to nitrogen and the more its yield swung from year to year. After 10 to 15 years of use, the response to nitrogen dropped sharply (Figure 8).
A buildup of disease and a loss of vigor in the variety are likely reasons. An earlier study found that the variety IR8 yielded more than 15% less than it originally did. Varieties on Philippine farms are about 10 years old on average. That may not be good enough to keep up with a changing environment or to make use of progress in breeding.
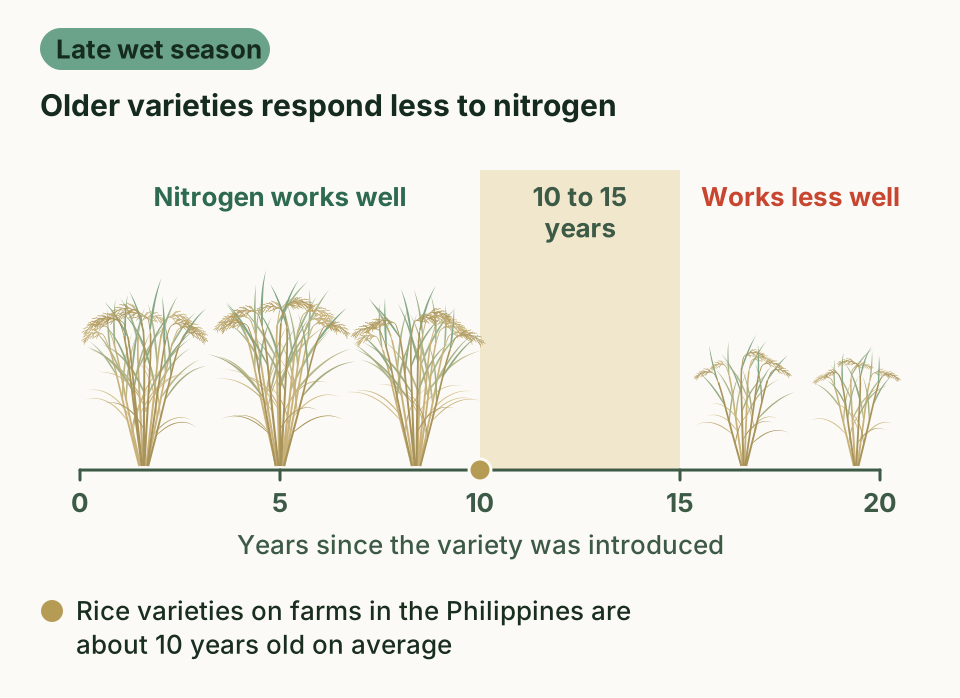
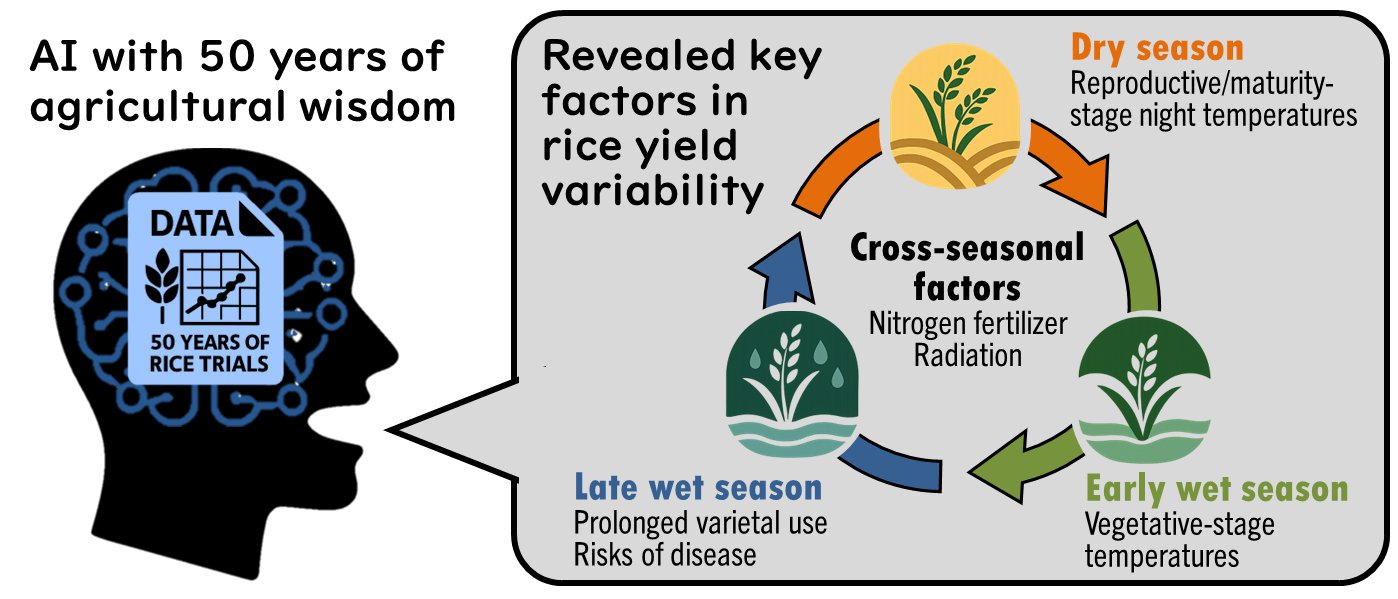
Figure 9 sums up these results in one picture.
Matching varieties and management to each season
Even in the same field, the keys to yield changed with the season. Fertilizer, pest and disease control, and the choice of variety need to be planned for each season.
What can be tried now
Two ways to raise yields over the year stand out. One is to replace varieties more often, and the other is to use different varieties in the dry and wet seasons. Both are changes the experiment can adopt right away.
Directions for breeding
For breeders, the results point in two directions. The dry season calls for varieties that lose less energy to respiration. The wet seasons call for varieties that cope better with humid conditions and low sunlight. Both will need clear breeding goals and a careful look at the genetic diversity of these traits.
Getting more out of long-term experiments
Fifty years of records from one field can never be collected again. Machine learning can untangle factors that trend lines miss, and we hope the same approach will help other long-term experiments around the world.
What we do not know yet
These results come from a single irrigated field in the tropics. They are relevant to intensive irrigated rice farming in the tropics, but they may not apply directly to other regions or crops.
The disease risks were calculated from the weather, so they leave out actual infections and the effects of crop protection. Soil properties were not used directly either. We used the number of crops grown so far as a stand-in.
Machine learning only finds links in the data, so the relationships found here are also hypotheses to test in the field. Next steps include regular field checks for disease, analyses of stored soil samples, and extending the approach to other long-term experiments and crops.
Glossary
- Long-term continuous cropping experiment
- A trial that grows the same crop in the same field for decades and records its yields. Here it means the IRRI trial that has grown three rice crops a year since 1968.
- Machine learning
- Methods that learn patterns from data and use them, for example, to make predictions. They can learn complex relationships without a formula fixed in advance.
- Random forest
- A machine learning method that grows many decision trees and averages their predictions. It is widely used for data arranged in tables.
- Explainable AI (XAI)
- Techniques that show, in a form people can understand, which information an AI prediction was based on.
- SHAP
- A method that shows how much each factor pushed a single prediction up or down, in the same unit as the prediction.
- Growth stages
- Early growth, when the plant puts out leaves and tillers (side shoots), runs from planting until the young panicle starts to form. Panicle formation runs until flowering, and grain filling runs from flowering to maturity.
- Sustainable yield index
- The average yield minus its year-to-year spread (the standard deviation), divided by the highest yield. Values closer to 1 mean that yields stayed high and steady.
- Tungro
- A viral disease of rice. In this study, its risk was a score of how favorable the weather was for the disease.
About the paper
Tomoaki Yamaguchi, Olivyn Angeles, Toshichika Iizumi, Achim Dobermann, Keisuke Katsura & Kazuki Saito (2025). Machine learning reveals drivers of yield sustainability in five decades of continuous rice cropping. Field Crops Research, 333, 110114. https://doi.org/10.1016/j.fcr.2025.110114
This paper is not open access. Anyone can read the abstract on the publisher's website, but the full text may require a subscription. The figures here are new drawings based on the paper's numbers, plus the authors' graphical abstract.