04 — Publications / Explainer
Data from single rice hills
can train reliable drone models
A lighter way to collect the field data that drone models learn from
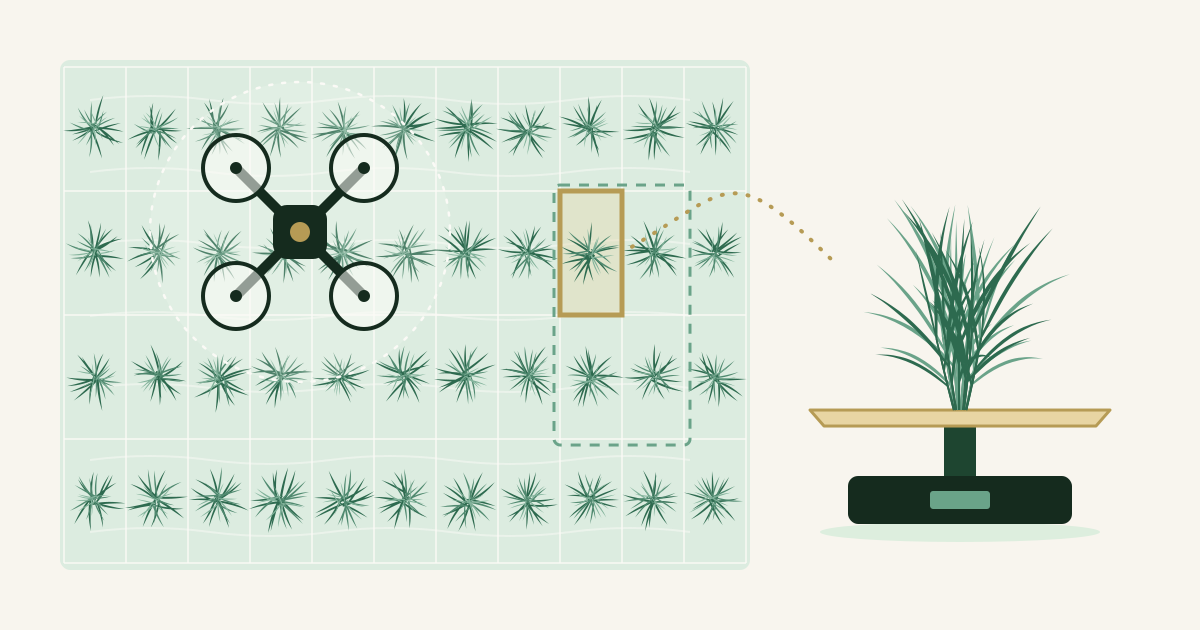
To estimate rice growth from drone images, researchers first need measurements from plants that were cut in the field, dried, and weighed. Each measurement has usually been the average of several neighboring hills, the small clumps of seedlings that are planted together. We tested whether measuring each hill on its own works as well. Simple models based on one feature were just as accurate, and more single-hill data improved machine learning models.
Key points
- With simple models that use one feature, such as plant height, data from single hills gave almost the same accuracy as averages of two or four hills.
- Single-hill data contain more noise, and some machine learning methods lost accuracy with them. When we doubled or quadrupled the single-hill data, most methods became more accurate.
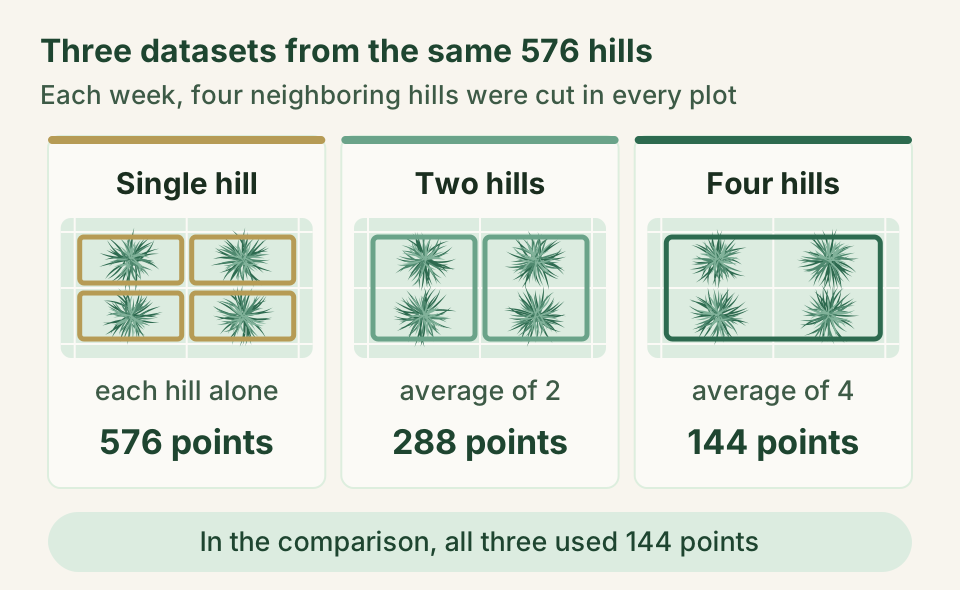
- The same 576 harvested hills give 576 data points when each hill counts on its own, but only 144 as four-hill averages. Using single hills could reduce the work of collecting field data.
Why researchers cut and weigh rice plants
Two measures tell us a lot about how a rice crop is growing. Above-ground biomass is the dry weight of everything above the soil, expressed per unit of field area. It helps predict grain yield and shows how healthy the plants are and how much nitrogen they hold. Leaf area index (LAI) compares the total area of the leaves with the area of ground they cover, and it reflects the crop's capacity for photosynthesis. Timely, accurate values matter for breeding trials, for managing fields, and even for agricultural policy.
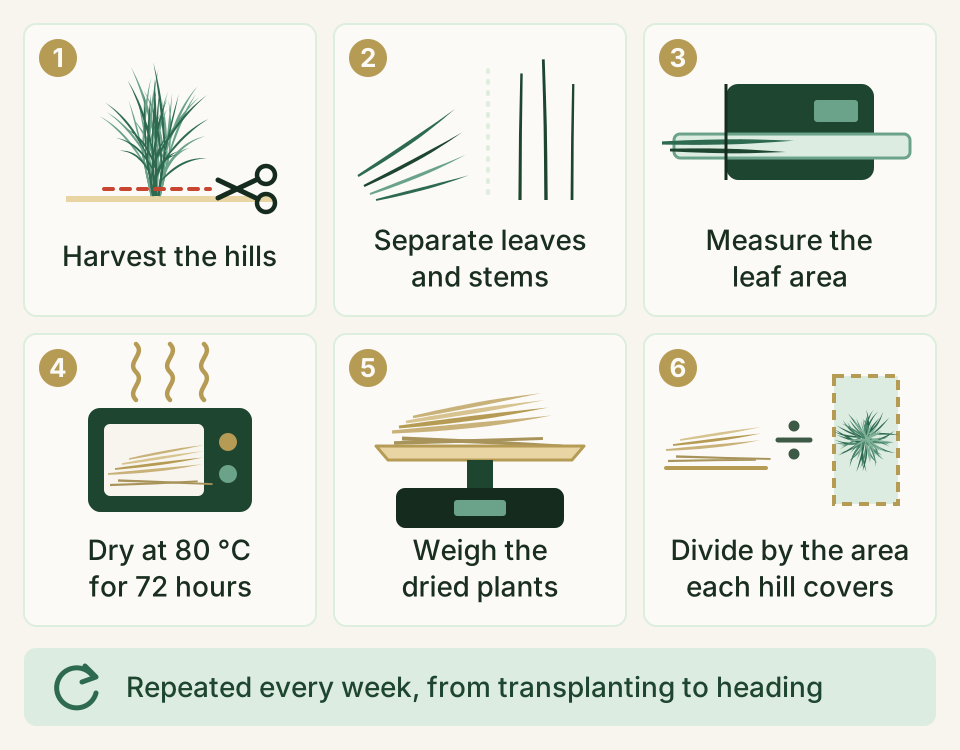
Measuring them directly means harvesting plants. In our study, each harvested hill was split into leaves and stems, and a machine measured the leaf area. The samples then dried in an oven at 80 °C for 72 hours before we weighed them. Finally, we divided by the ground area the hill had occupied to get values per unit area (Figure 1). We repeated this every week, from transplanting until heading, the stage when the grain heads emerge.
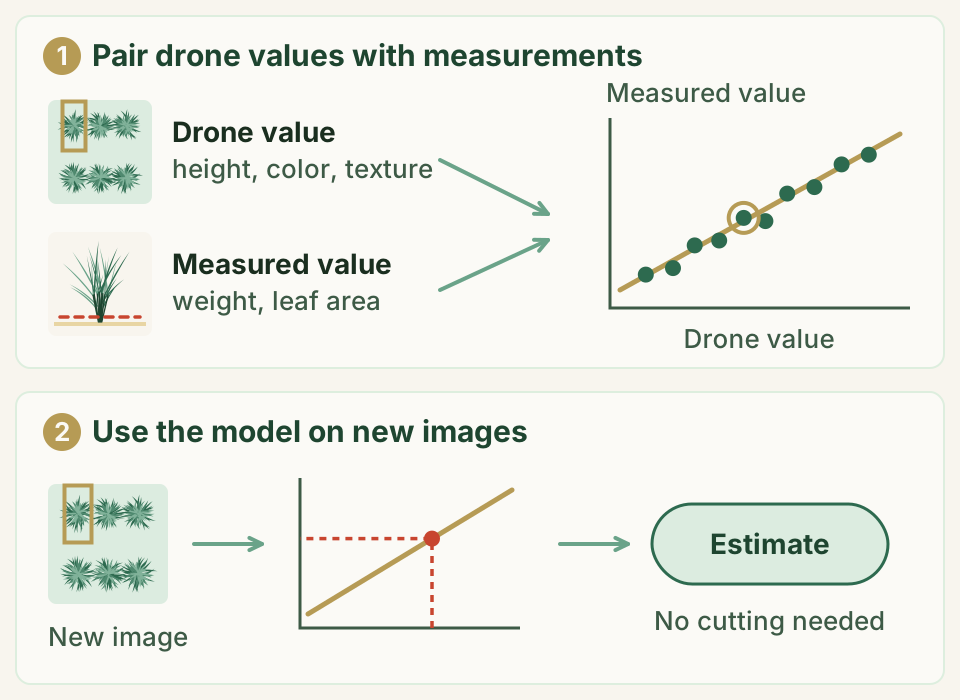
A drone can photograph a large field in a single flight. But to turn images into estimates of weight or leaf area, we first need a model. A model is a rule that links what the drone sees to what we measure on the ground. We build it from many pairs of drone values and hand measurements (Figure 2). These hand measurements are called ground truth. Accurate models need plenty of ground truth, and collecting it has long been one of the main bottlenecks in this research.
How many hills should we cut?
Crop scientists usually harvest several hills and average them for each data point, because hills in the same plot grow a little differently. Earlier drone studies used 4, 8, or 20 hills per data point. If single hills were good enough, the same amount of data could come from less field work.
There was a catch, though. In drone images, leaves from neighboring hills overlap the area of a single hill. Seedlings are also never planted in a perfect grid, so the frame drawn around a hill in the image may not line up with it. This noise could matter more when each data point comes from fewer hills, and no one had yet tested how much it matters.
Comparing data from one, two, and four hills
The field experiment
We grew the rice variety Koshihikari in 2020 in a paddy field at Tokyo University of Agriculture and Technology in Fuchu, Tokyo. Each hill had three seedlings, and the hills were spaced 15 cm × 30 cm. We transplanted on three dates (May 20, June 3, and June 17). Half of the plots received no nitrogen fertilizer. The other half received 2 g of nitrogen per square meter at the start and another 2 g later in the season. Three sets of these six combinations made 18 plots in total.
Every week from transplanting to heading, a drone flew over the field at a height of 30 m. It carried an ordinary color camera and a camera that records five bands of light separately, including near-infrared. Right after each flight, we harvested four neighboring hills in every plot, one by one, and measured them as shown in Figure 1. In total, we harvested 576 hills.
Reading each hill from the images
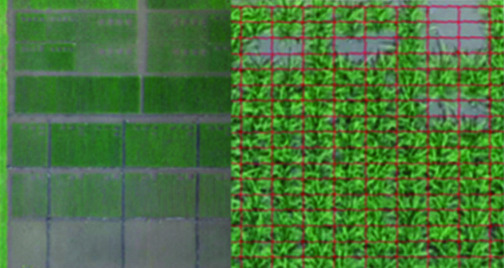
We stitched the photos into a top-down map of the field and a 3D model of its surface. On the map, we placed a 15 cm × 30 cm frame around each hill and averaged the values inside it (Figure 3). This gave three kinds of features for each hill.
- Plant height comes from the 3D model. It is the height of the crop surface on the flight day minus the height of the ground before the plants grew.
- Vegetation indices combine the brightness of different colors of light and are widely used to track how plants grow. We calculated 14 of them.
- Texture indices turn the fine patterns of light and shade in an image into numbers. From many candidates, we kept the 8 that gave the most accurate estimates.
Each harvested hill now had a pair of values, one from the drone and one from the hand measurement.
Three ways to build a dataset
From the same 576 hills, we built three datasets (Figure 4). The single-hill dataset uses each hill on its own. The two-hill dataset averages two neighboring hills, and the four-hill dataset averages all four, an approach also used in earlier studies. In every case, the drone values and the hand measurements were averaged in the same way.
This gave 576, 288, and 144 data points. To compare the datasets fairly, we randomly kept one single-hill point and one two-hill point per plot and date, so that every dataset had 144 points.
Building and testing the models
We built two kinds of models. A single regression uses one feature, such as plant height, and fits a straight line between it and the measured value. Machine learning combines many features, and we tried 13 different methods.
We judged each model on data it had not seen. The 18 plots formed three sets, and each set covered every growing condition. We trained a model on two sets (96 points) and tested it on the third (48 points). We then rotated the sets so that each one served once as the test (Figure 5). The test always used the four-hill data, which we expected to contain the least noise.
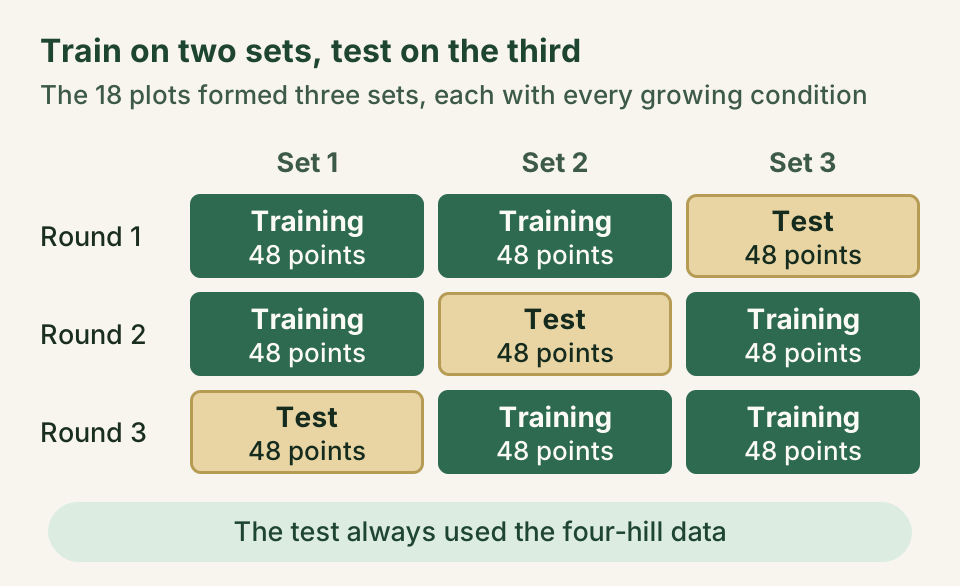
We also changed the amount of training data, the data a model learns from. For single regression, we cut it from 96 points to 32 and 16. For machine learning, we doubled and quadrupled the single-hill training data, to 192 and 384 points.
What changed when we used single hills
Simple models were just as accurate
We used two common scores. The coefficient of determination (R²) shows how closely the estimates follow the measurements, and 1 means a perfect match. RMSE is the typical size of the error, so smaller is better.
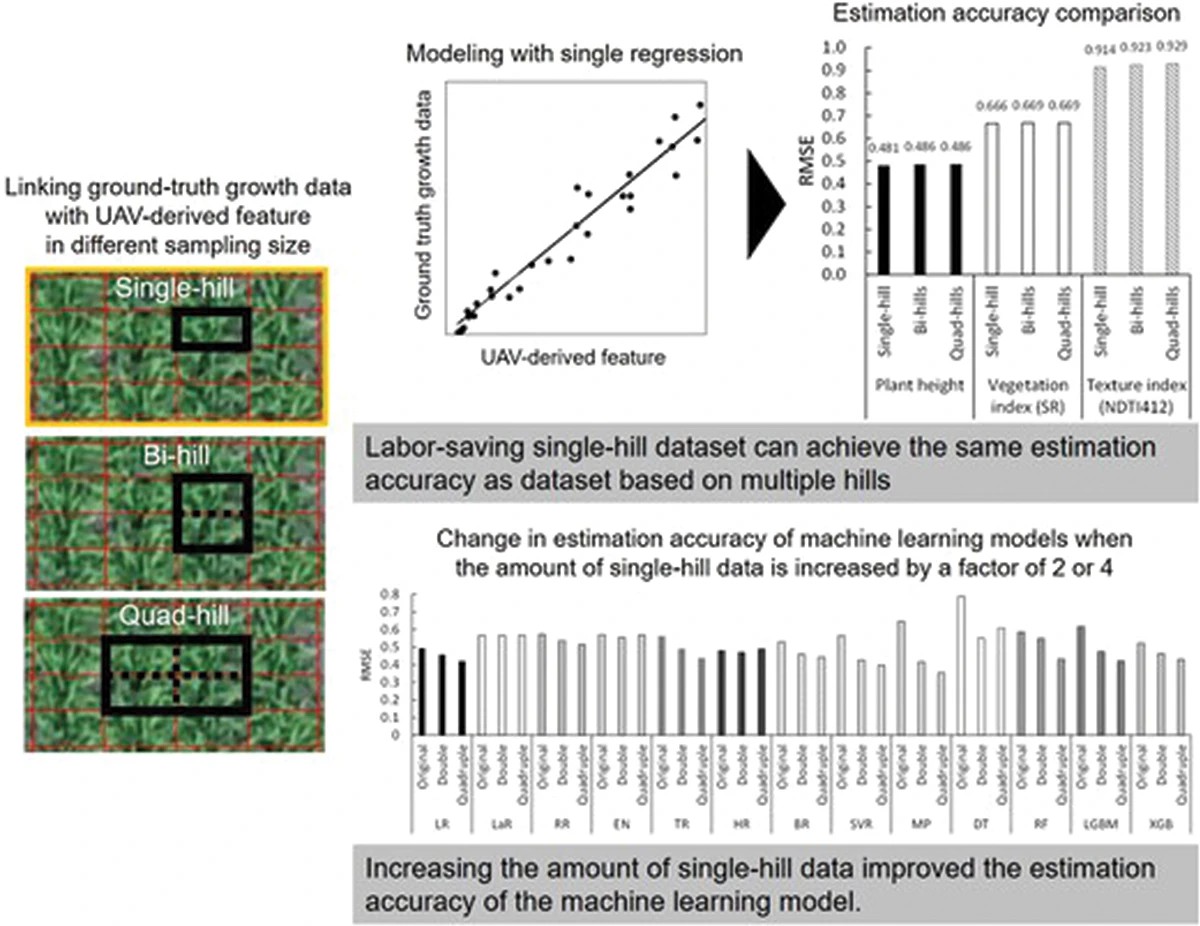
When plant height was used to estimate biomass, R² was 0.954 with single hills, 0.952 with two hills, and 0.954 with four. The RMSE was 0.481, 0.486, and 0.486 metric tons per hectare (Figure 6). The pattern held for the vegetation and texture indices, and for leaf area index as well. The number of hills made almost no difference.
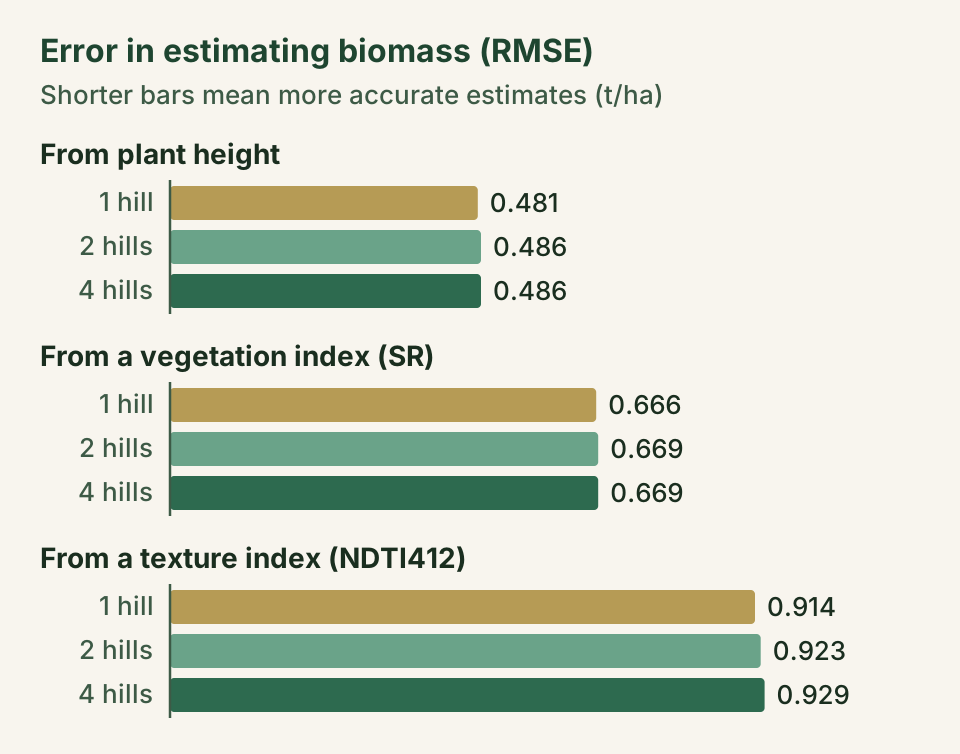
There was one difference. The models fit their training data less well when each data point came from fewer hills, a sign of extra noise in single-hill data. Even so, the finished models estimated the test data with almost the same accuracy.
Cutting the training data to 32 or 16 points did not open a gap between the datasets either. With 16 points, plant height still estimated biomass with an R² of 0.950 for single hills, 0.953 for two hills, and 0.952 for four. As long as the training data cover the range of growth to be estimated, accuracy does not seem to drop much with fewer points.
Some machine learning methods felt the noise
Among the 13 machine learning methods, the most flexible ones, which can follow the data very closely, tended to lose accuracy with single-hill data. They included a neural network called a multilayer perceptron (MP), as well as LightGBM and XGBoost (Figure 7). Overall, the difference between the single-hill and four-hill datasets was statistically significant.
With fewer hills per data point, the errors also tended to grow as the plants got bigger. Large plants overlap their neighbors more, and a slightly misplaced frame matters more, so the noise likely increases later in the season. Methods designed to resist outliers, such as Lasso and Huber regression, sometimes kept the same accuracy across all three datasets.
More single-hill data made machine learning better
Machine learning tends to work best with plenty of data. So we trained the models on 96, 192, and 384 single-hill points. Most methods became more accurate, and MP, LightGBM, and XGBoost improved the most. The differences between the training sizes were statistically significant (Figure 7).
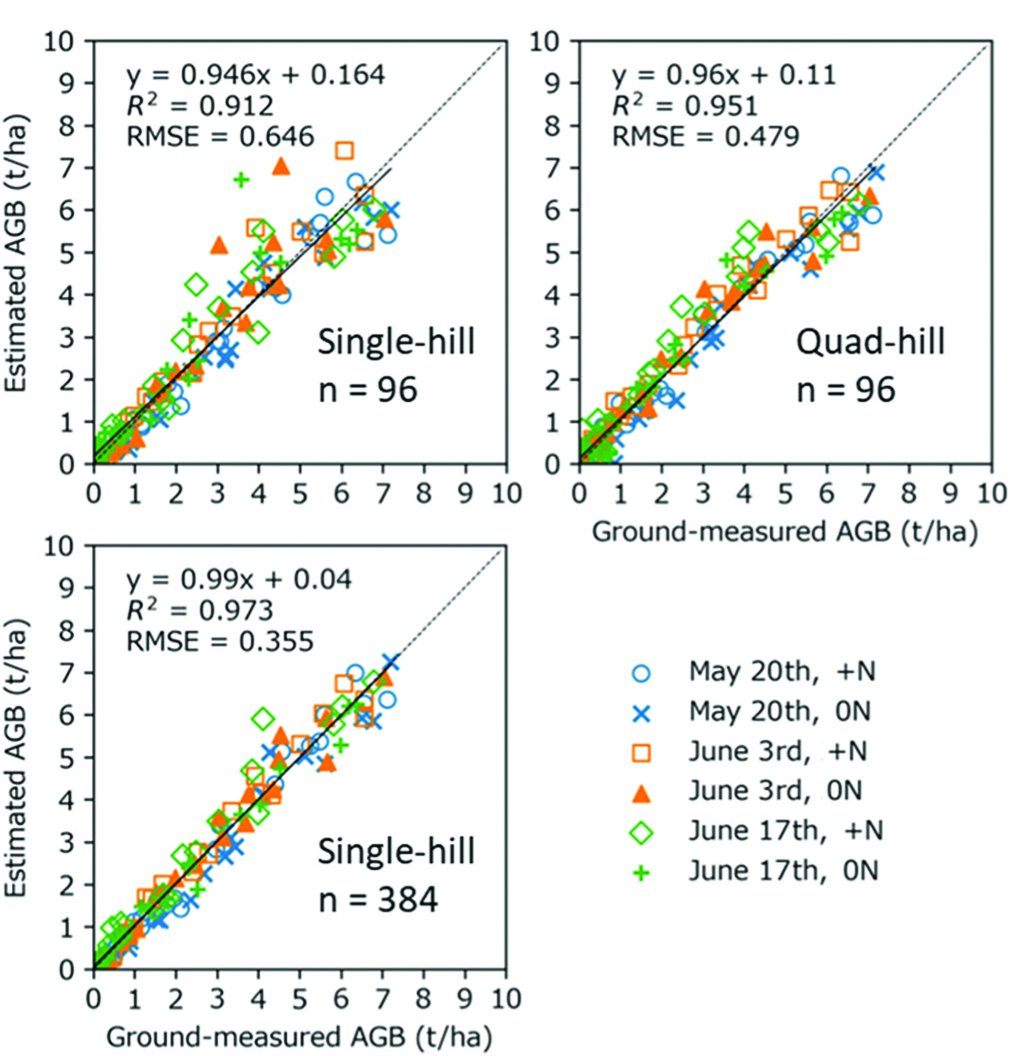
Single-hill data carry a little more noise. Still, as long as the data are reliable enough, collecting more of them can make machine learning models more accurate.
Where this helps, and what we still need to test
The link between drone images and crop growth shifts with the environment, the shape of the plants, and the growth stage. Accurate estimates therefore need a model built for each situation, and each new model needs fresh ground truth. Our results make that work lighter. Single regression models can be built from single-hill data, and when the data span the range of growth to be estimated, fewer data points may be enough.
Because our models were tested on four-hill averages, the results also show that models trained on single hills can estimate growth over larger patches of crop. This could help with mapping growth across farmers' fields and with comparing many breeding lines (candidates for new varieties) in screening trials.
For machine learning with single-hill data, it helps to choose noise-resistant methods or to collect more data.
Our experiment used one variety, Koshihikari, in one field and in one year. Plant shape changes with the variety and the environment, so the amount of noise may differ elsewhere. The results still need to be confirmed with other varieties, places, and years.
Until now, each ground-truth data point for drone models of rice usually came from several harvested hills. We showed that single hills can also be used, which could make collecting ground truth for future models less laborious.
Glossary
- Ground truth
- Values measured directly in the field and used to build and check estimation models. In this study, they are the dry weight and leaf area of harvested rice.
- Hill
- A small clump of rice seedlings planted together. In this study, each hill had three seedlings.
- Above-ground biomass
- The dry weight of the plant parts above the soil per unit of ground area, here in metric tons per hectare (t/ha). One t/ha equals 100 g per square meter.
- Leaf area index (LAI)
- The total area of the leaves (one side) divided by the area of ground beneath them. It is a common indicator of a crop's capacity for photosynthesis.
- Vegetation and texture indices
- Numbers calculated from drone images. A vegetation index combines the brightness of different colors of light, and a texture index describes fine patterns of light and shade.
- Noise
- Variation in the data that has nothing to do with the true value. Here it comes from neighboring leaves in the image and from frames that do not line up with the hill.
- Single regression
- A model that uses one feature, such as plant height, and fits a straight line between it and the measured value.
- Machine learning
- Methods that let a computer learn, from many examples, how features relate to the answer. They can capture complex patterns, but some are easily misled by noise.
- R² and RMSE
- Two scores for accuracy. R² (the coefficient of determination) is better the closer it is to 1, and RMSE (root mean squared error) is better the smaller it is.
About the paper
Tomoaki Yamaguchi, Kana Sasano & Keisuke Katsura (2024). Improving efficiency of ground-truth data collection for UAV-based rice growth estimation models: investigating the effect of sampling size on model accuracy. Plant Production Science, 27(1), 1–13. https://doi.org/10.1080/1343943X.2023.2299641
The paper is open access, so anyone can read it for free. It is published under a CC BY-NC 4.0 license (Creative Commons Attribution-NonCommercial 4.0 International). Figures 3 and 7 on this page are adapted from figures in the paper, and Figure 8 is its graphical abstract, all used under that license.