02 — Methods / Tutorial
Extracting Features from
Drone Imagery in QGIS
Compute vegetation indices and plant height from orthoimages and DSMs, then pull out a value per polygon
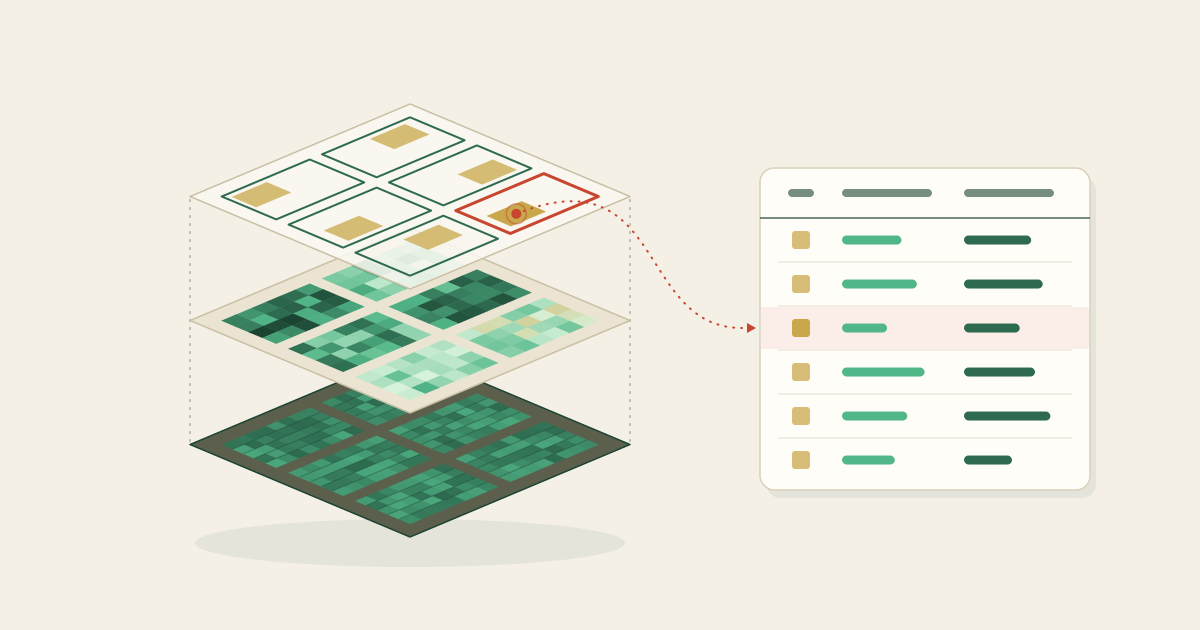
Orthoimages and digital surface models (DSMs) from a drone hold a lot of information about a crop's condition. If you compute features such as vegetation indices and plant height from them, and pull out a single value for each field polygon, you can compare and analyze growth plot by plot. This page walks through the whole flow step by step in the free GIS software QGIS. You open the data, compute the features, summarize them per polygon, and export them as a CSV file.
What you need (all free)
- QGIS Free GIS software, available from qgis.org.
- Orthoimage and DSM A .tif orthoimage and digital surface model (DSM) built from drone imagery.
- Polygons Vector data that divides the field into plots (.shp or .gpkg).
Open the data
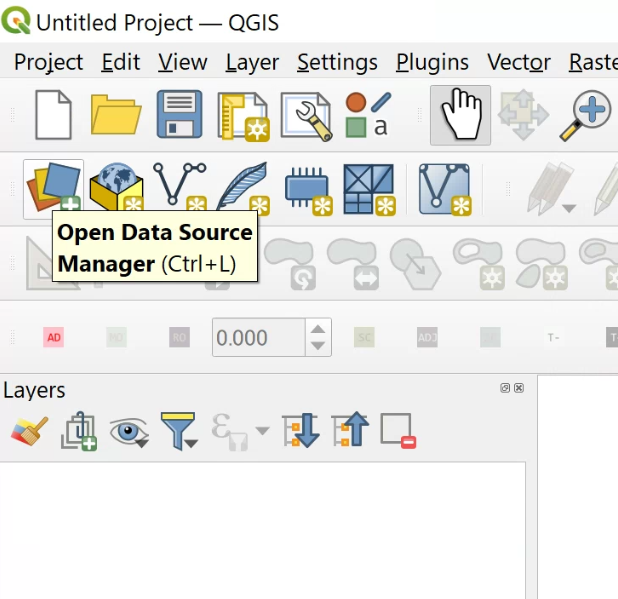
You load data into QGIS from the "Data Source Manager" (the icon at the top left of the toolbar, or Ctrl + L). Switch tabs depending on the type of data you are opening.
 (view larger image)
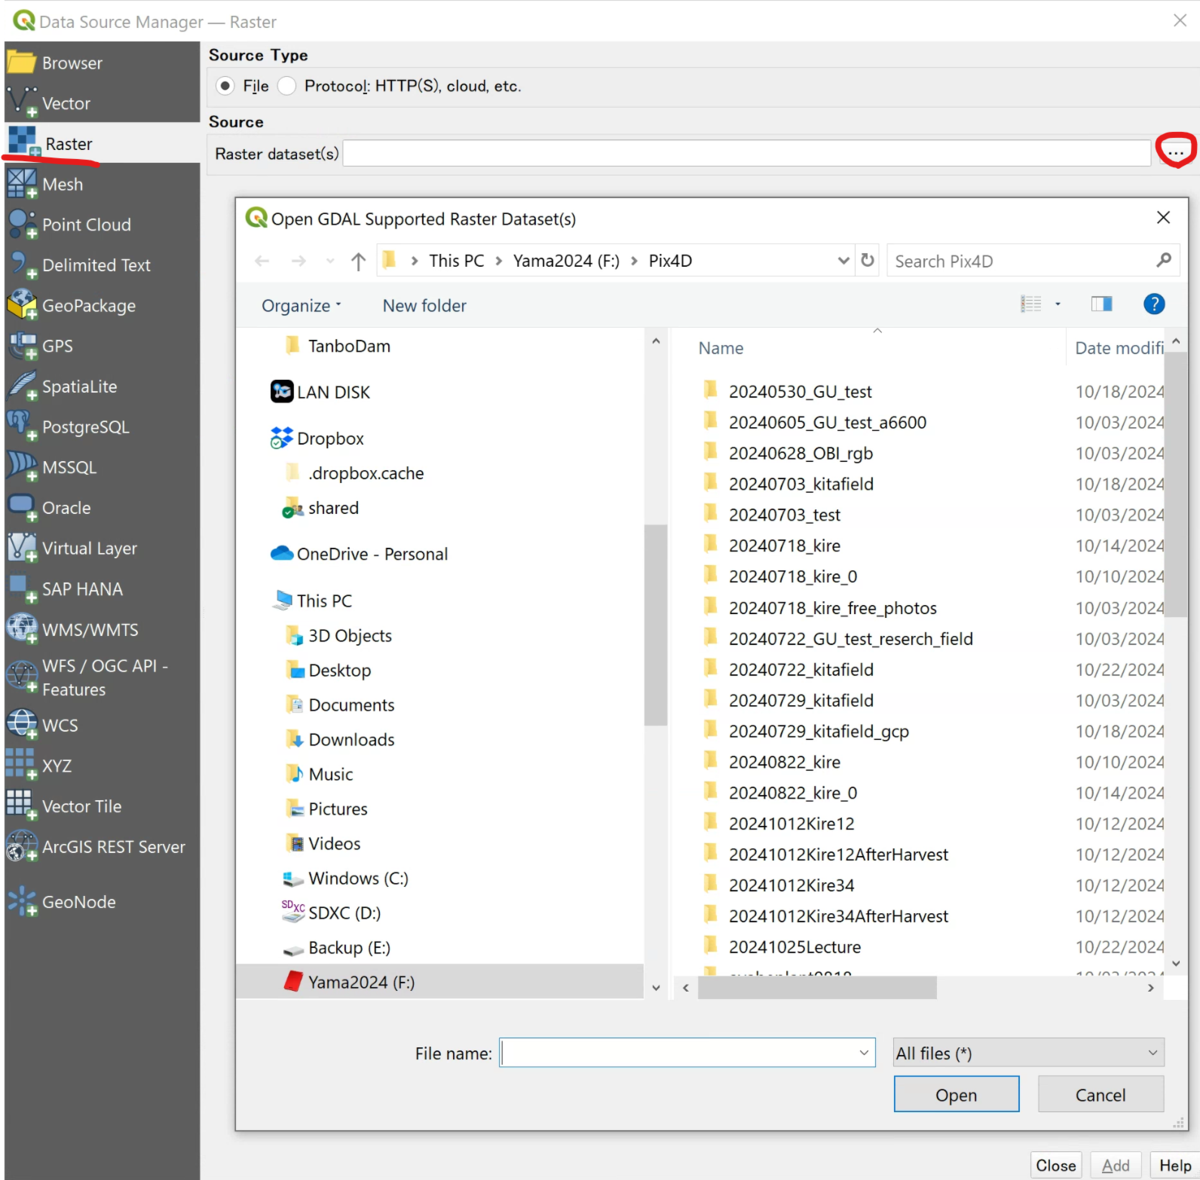
Open the orthoimage and DSM (raster)
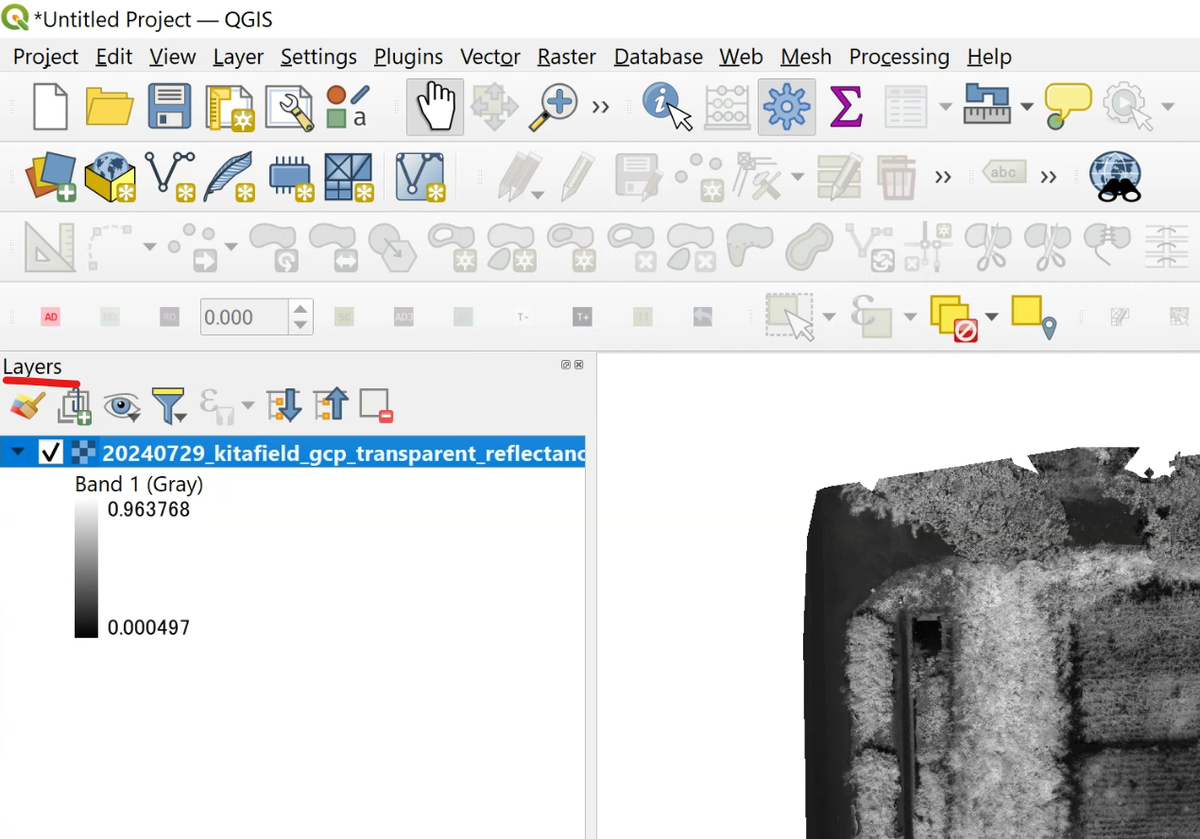
On the "Raster" tab, choose the .tif orthoimage or DSM and click "Add." If the image appears on the map, it loaded successfully.
 (view larger image)
 (view larger image)
Open the polygons
From the "Vector" tab, add the plot polygons (.shp or .gpkg). They appear layered over the orthoimage.
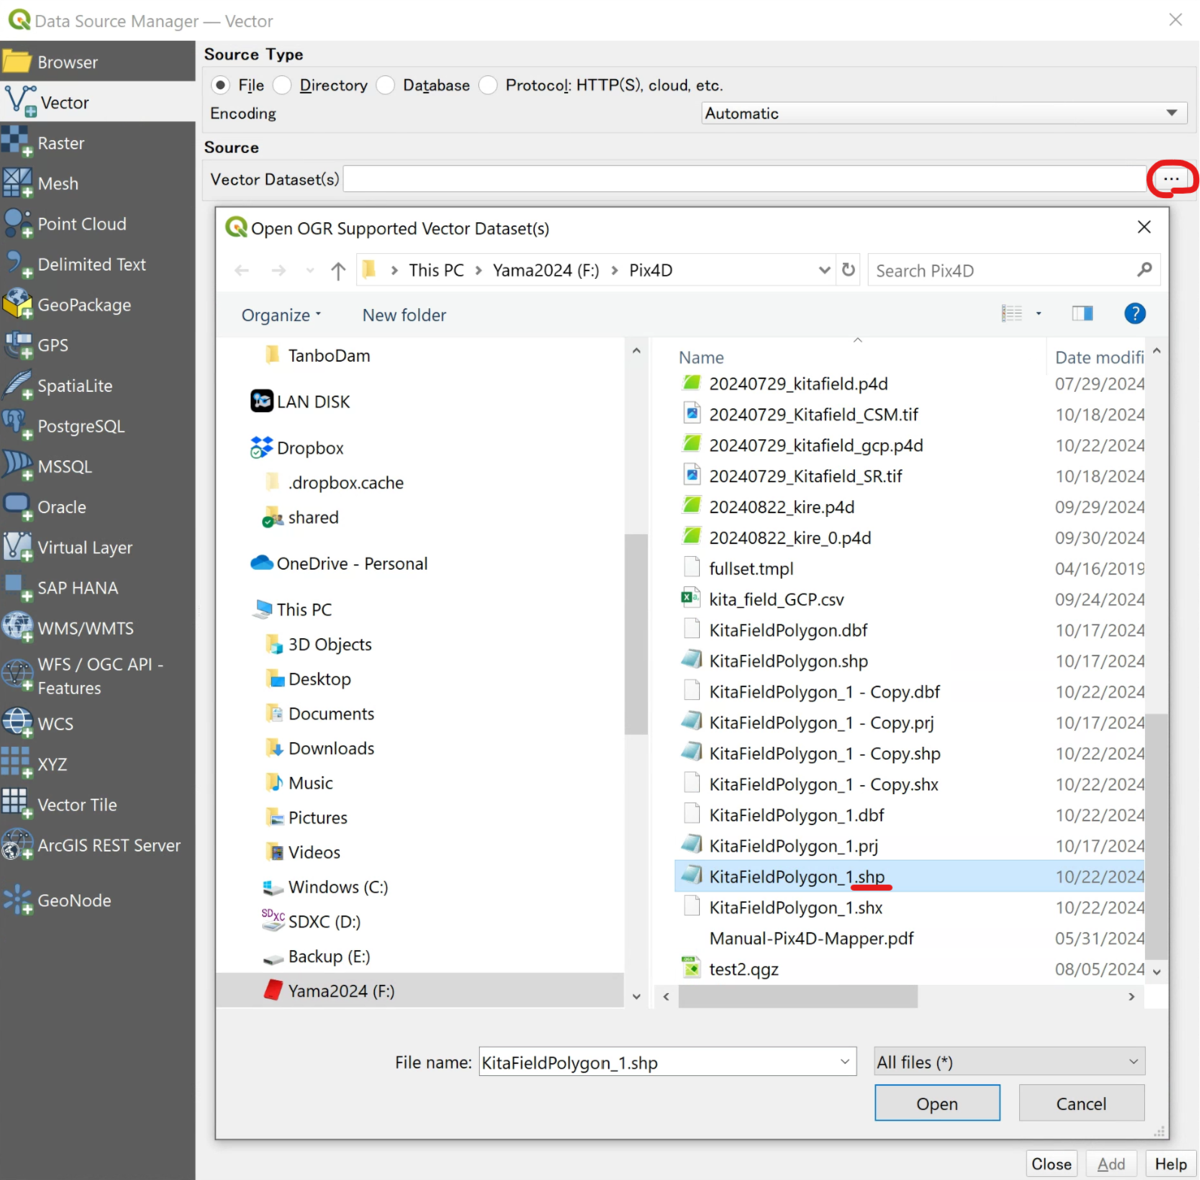 (view larger image)
Open a CSV or ground control points (GCPs)
To open a CSV that carries coordinates (such as ground control points), use the "Delimited Text" tab. Set the encoding to UTF-8 and the delimiter to comma, then check "First record has field names" and "Detect field types." If it has coordinates, choose "Point coordinates" under Geometry Definition and specify the X and Y (and Z, if any) fields.
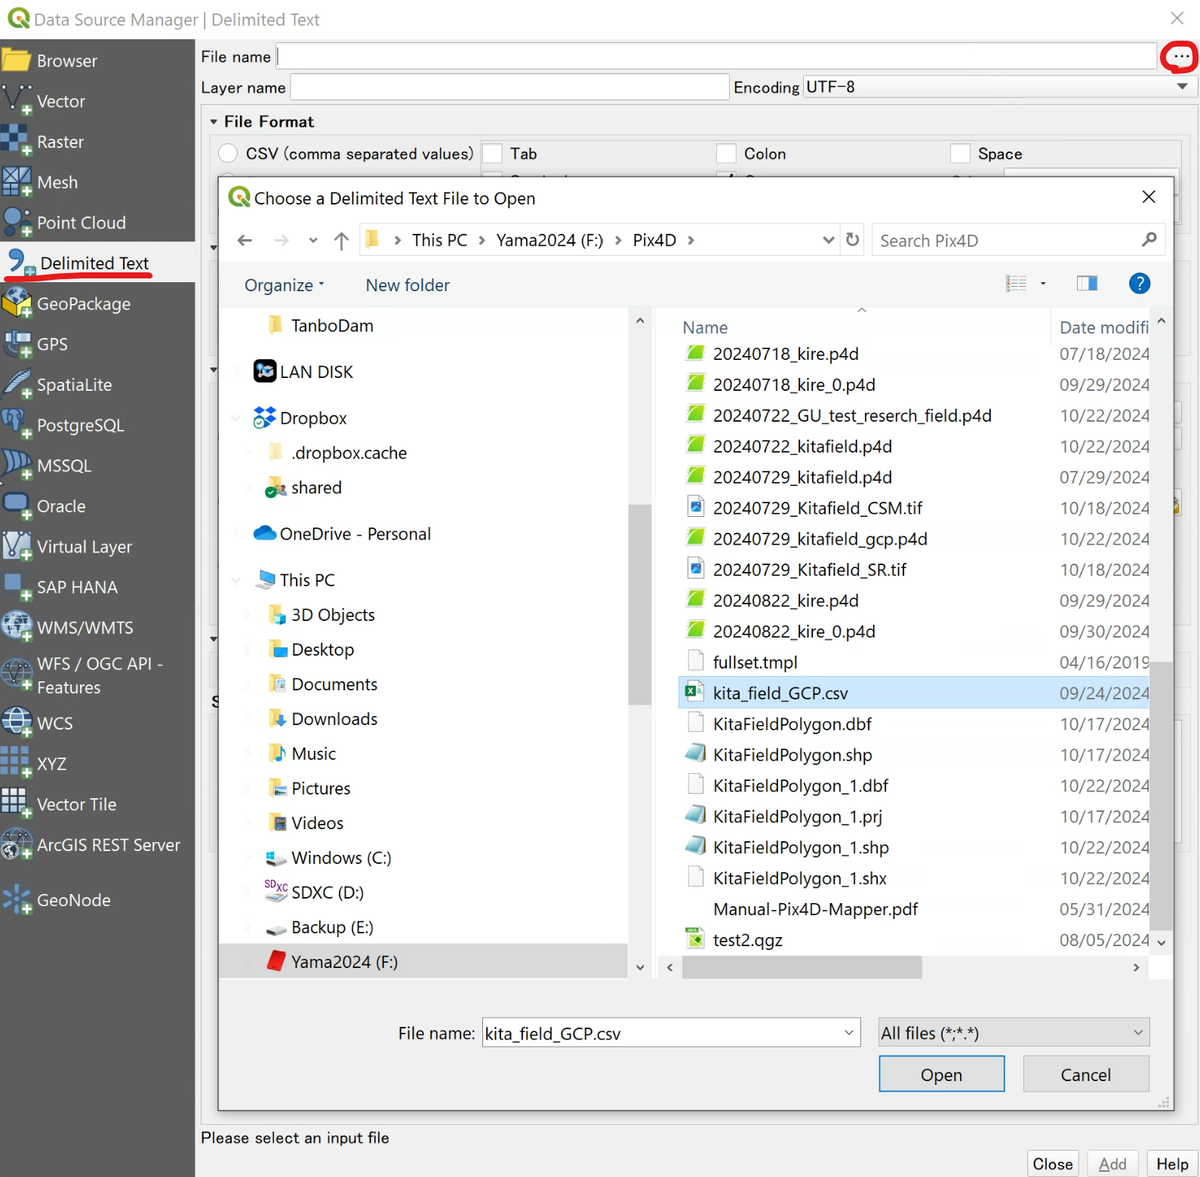 (view larger image)
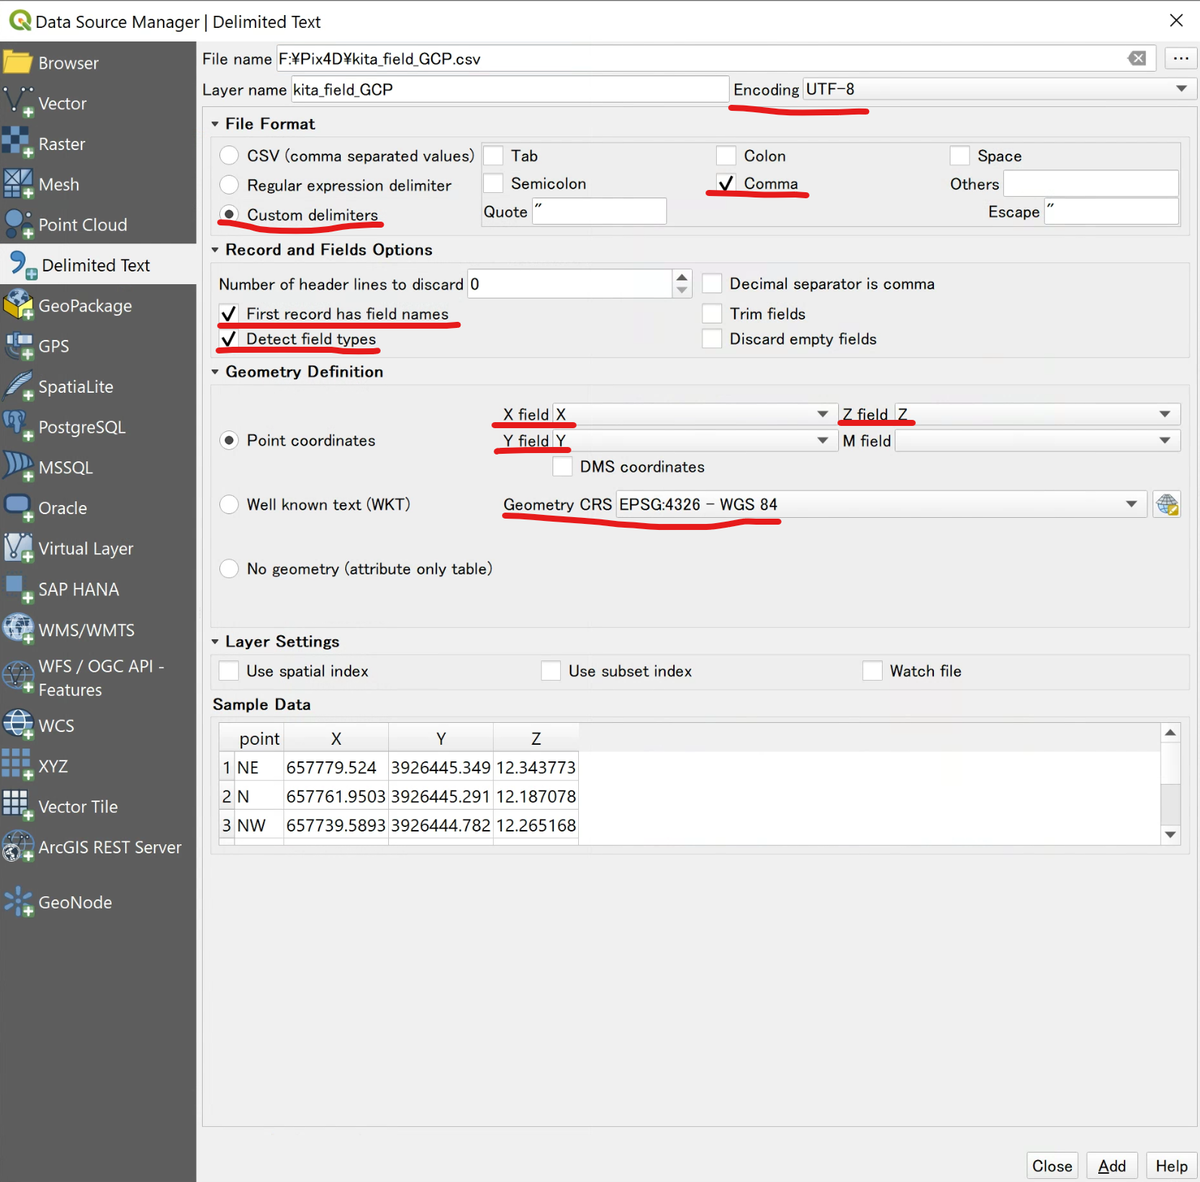 (view larger image)
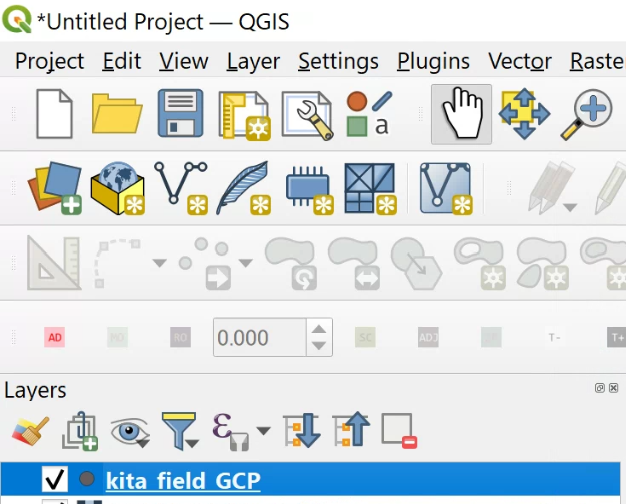 (view larger image)
 (view larger image)
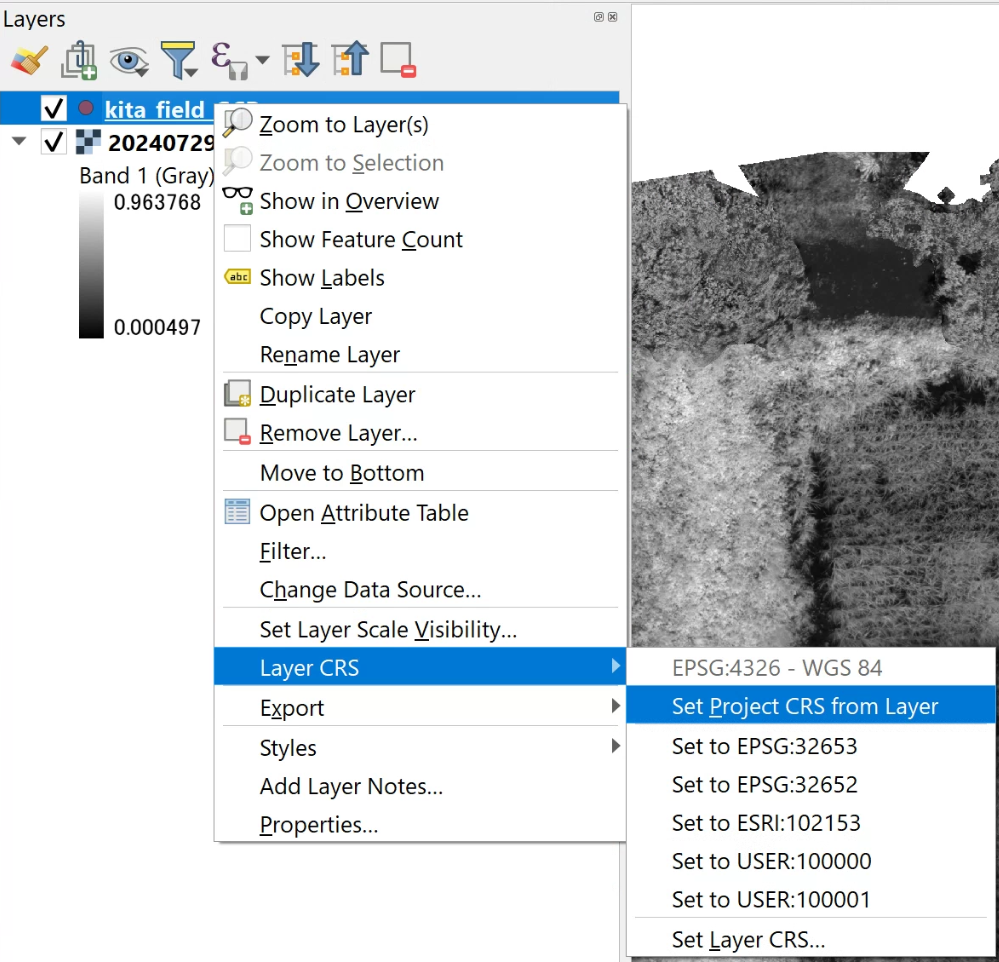
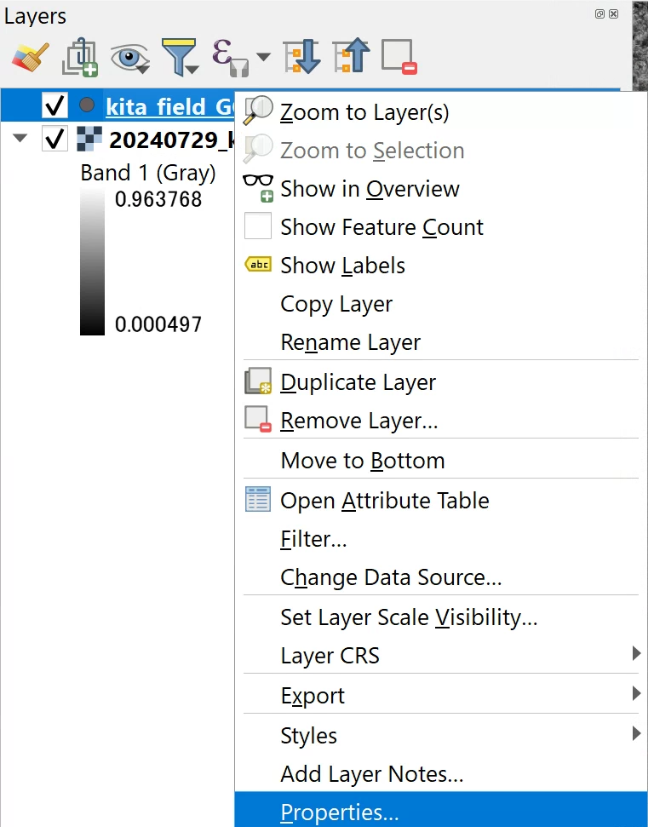
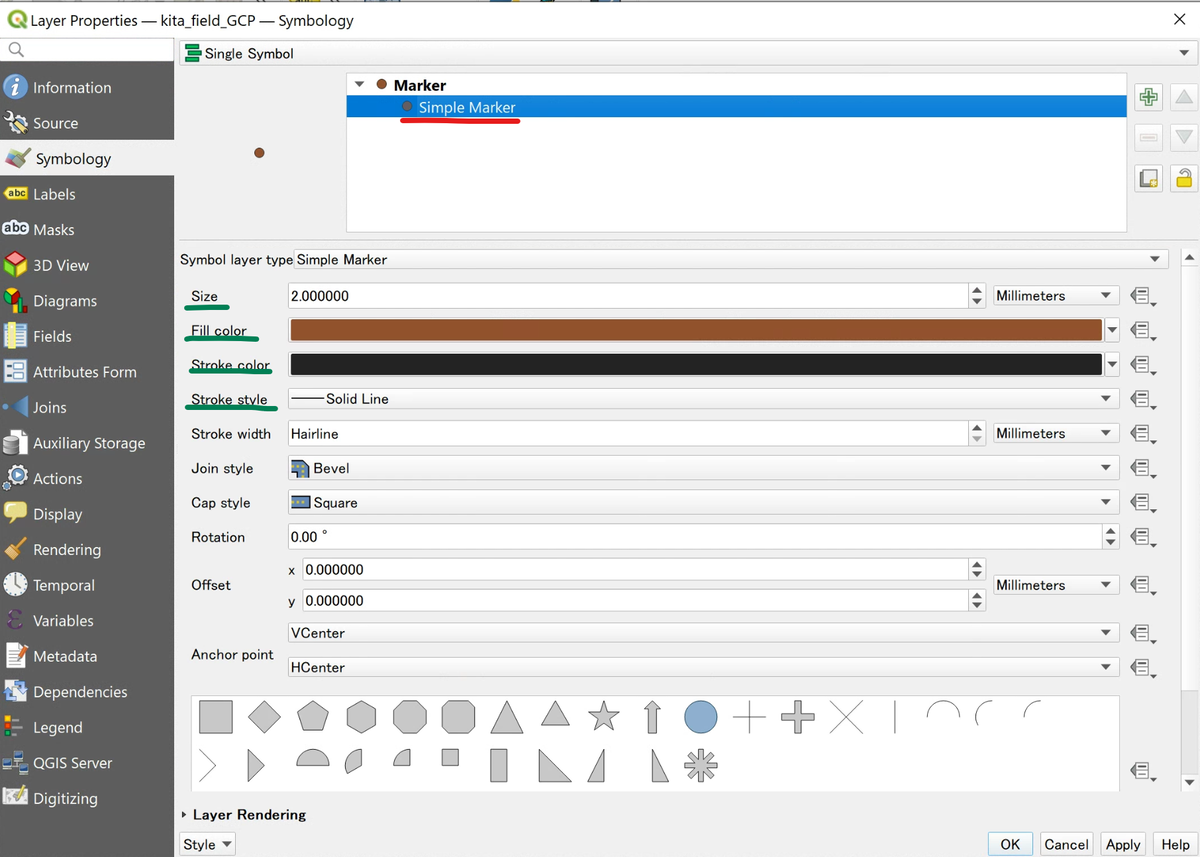
If the coordinate reference system (CRS) of the points does not match, right-click the layer and set it with a command such as "Layer CRS → Set Project CRS from Layer" (e.g., EPSG:32653). If the points are too small to see, adjust their size and color in the layer's "Properties → Symbology."
 (view larger image)
 (view larger image)
For a CSV that has attributes only, with no coordinates (a table of variety names, replication numbers, and so on), choose "No geometry (attribute only table)" under Geometry Definition. You will join it to the polygons in the next step.
Join attributes to the polygons
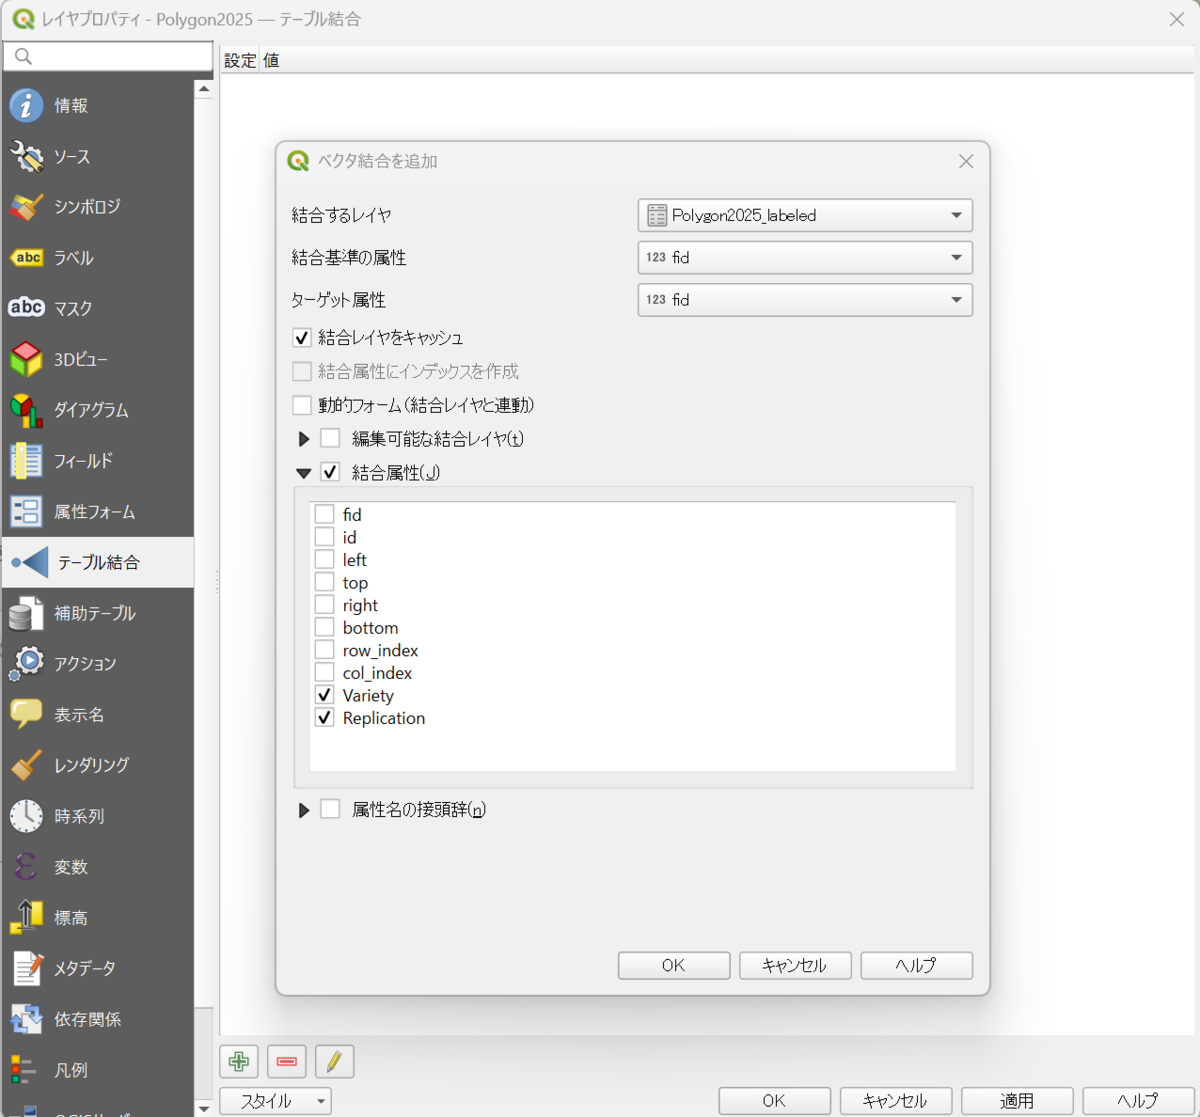
When plot attributes (variety, replication, and so on) live in a separate CSV, join them to the polygons using a shared column (for example, fid). Right-click the polygon layer and open "Properties → Joins," then click "+". Set the attribute CSV as the "Join layer" and the shared column as both the "Join field" and "Target field." Then check only the attributes you need and click "OK."
 (view larger image)
Check the joined attributes on the map
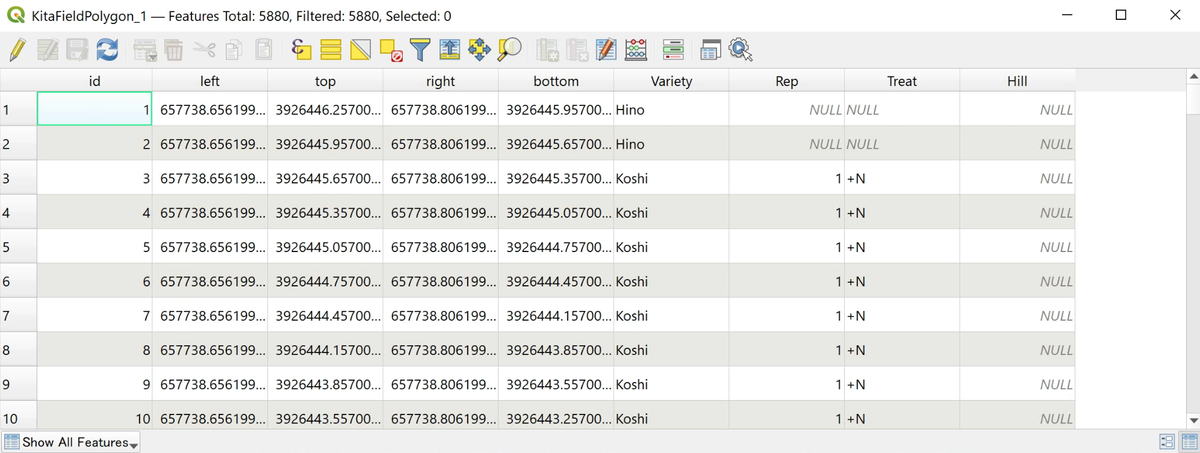
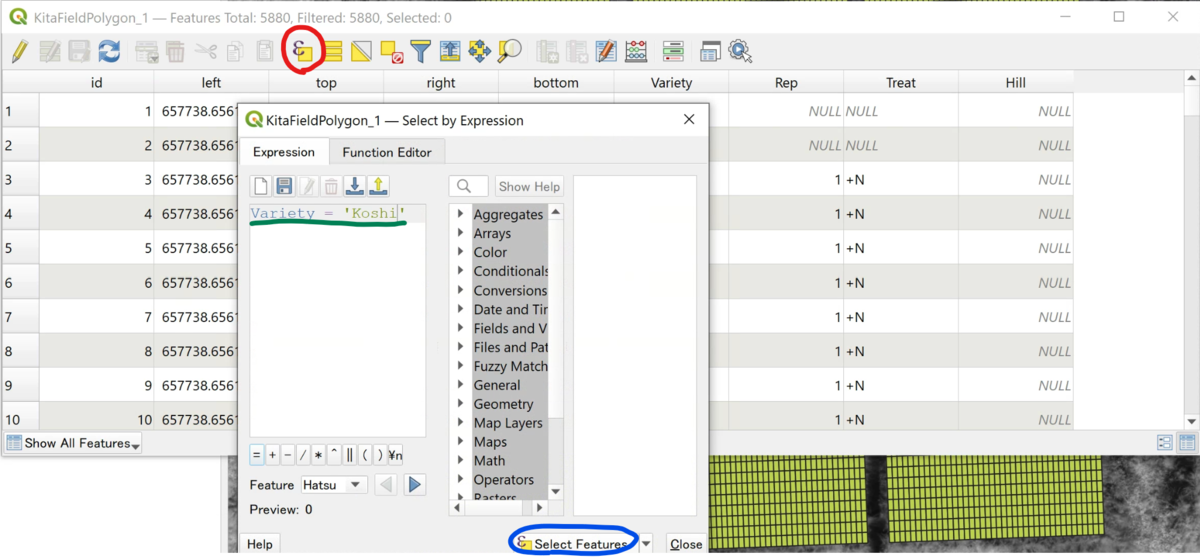
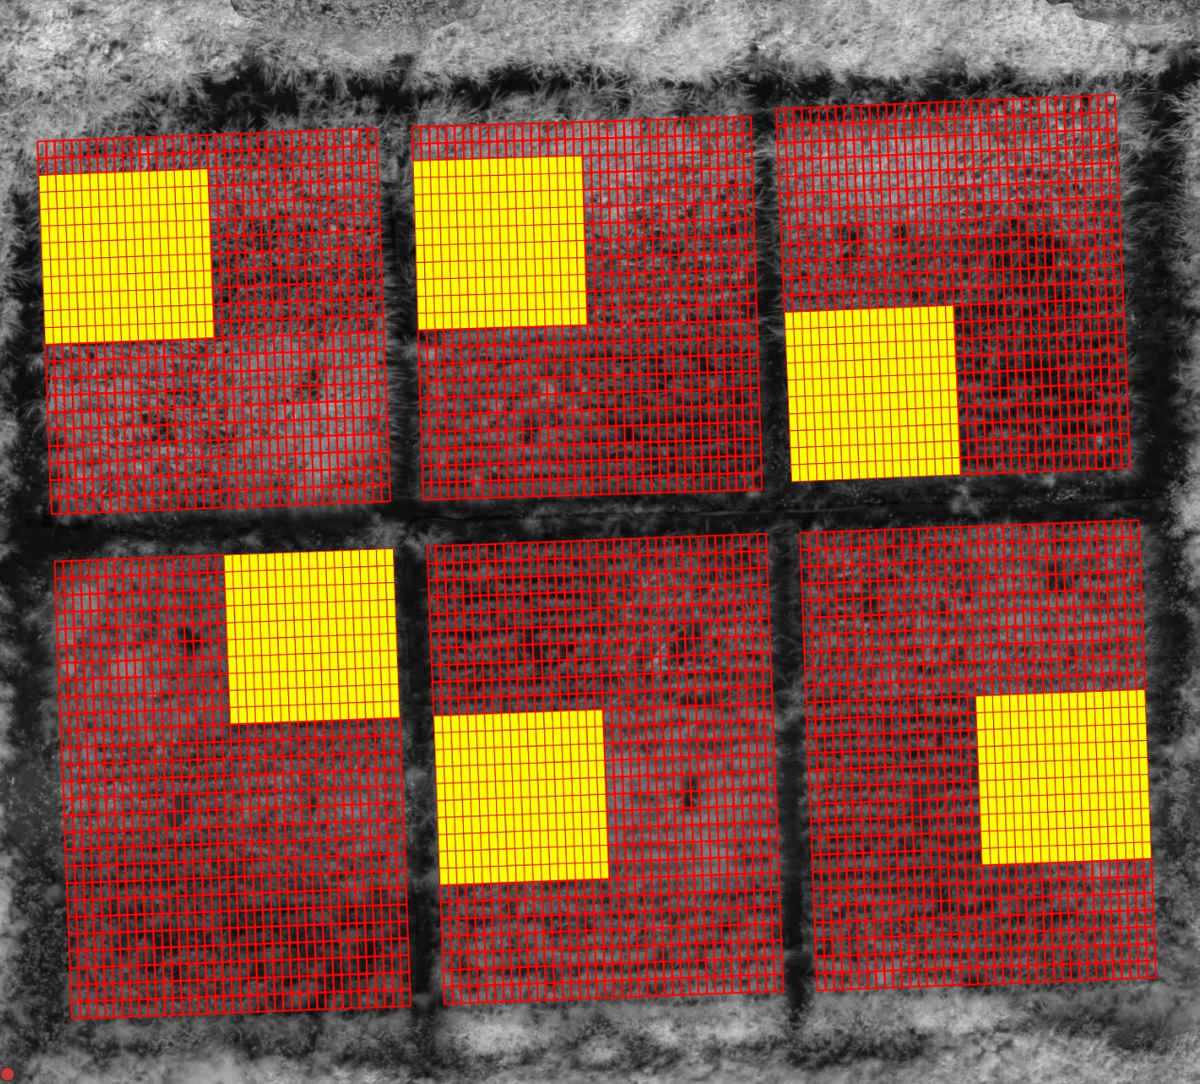
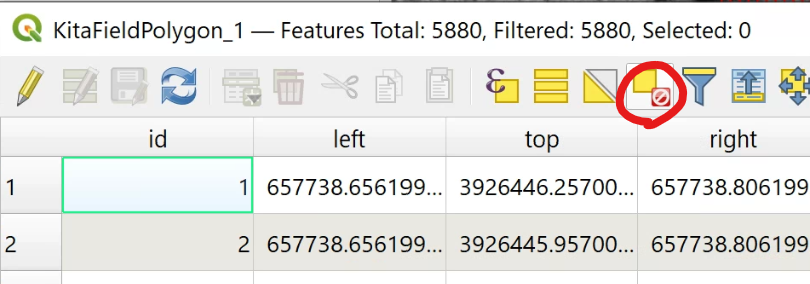
After the join, confirm that the attributes are linked to the right polygons. Open the polygon layer's attribute table and you will see the joined columns (such as variety) added. Using "Select by Expression," you can enter a condition like Variety = 'Koshi' to highlight only the matching plots on the map.
 (view larger image)
 (view larger image)
 (view larger image)
 (view larger image)
With labels, you can display the variety name or number directly on each plot. Check on the map that the plots are laid out the way you intend.
Getting around the map
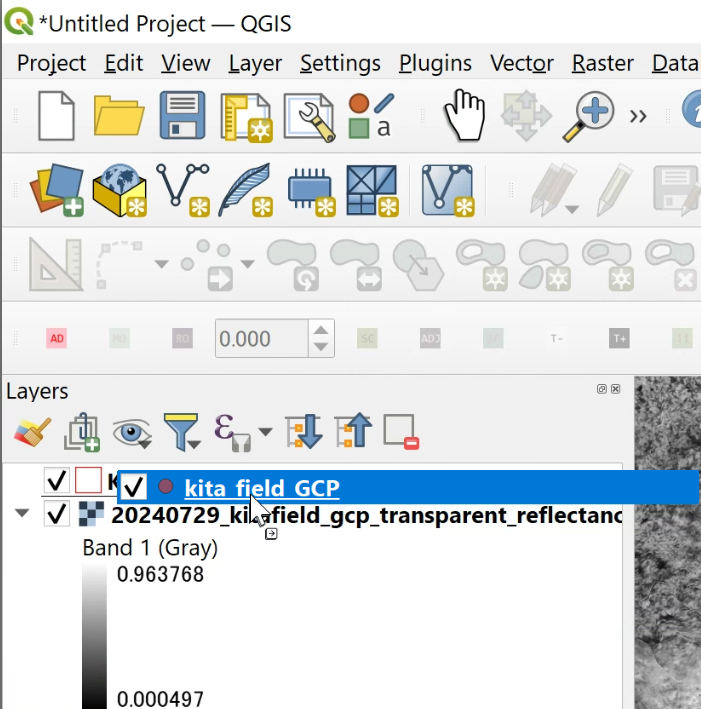
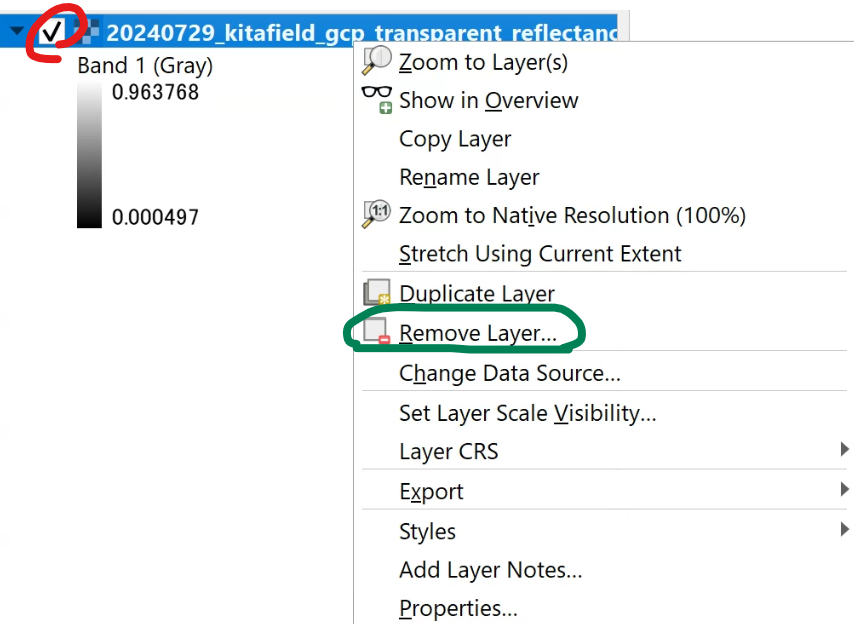
A few basics make the work much smoother. Drag to pan, use the mouse wheel to zoom, and toggle the checkboxes in the "Layers" panel to show or hide layers. Layers higher in the list are drawn in front, so reorder them to control what overlaps what.
 (view larger image)
 (view larger image)
Compute features (vegetation indices and plant height)
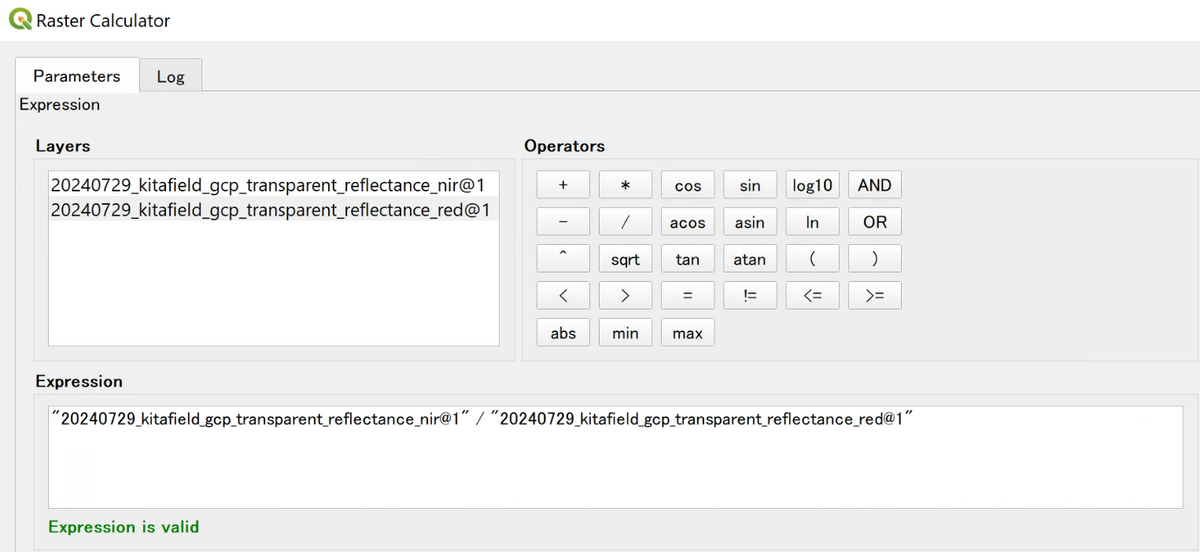
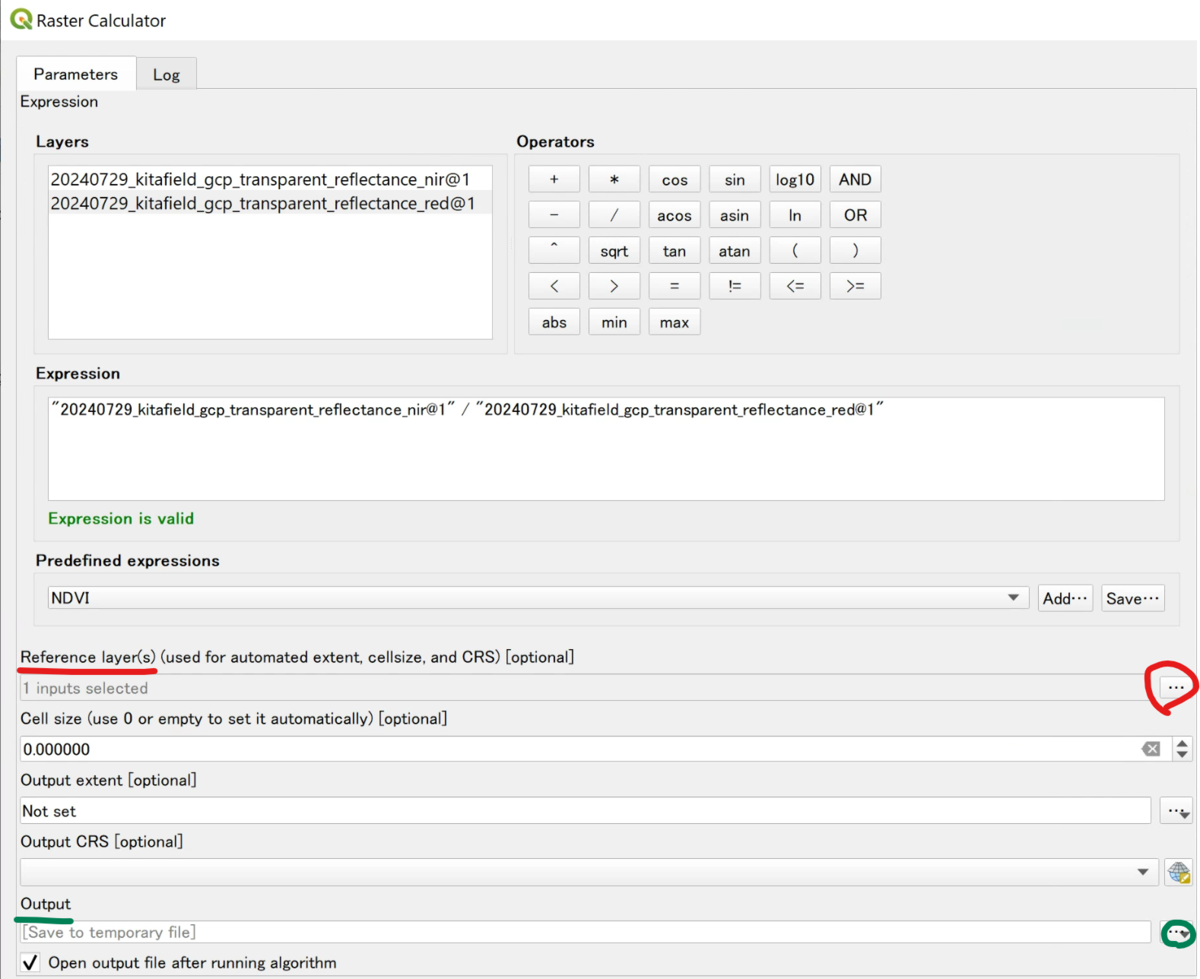
Compute features with the "Raster Calculator" ("Processing → Toolbox → Raster analysis → Raster calculator"). In the expression field, write a formula that combines the bands you want. For the simple ratio (SR) index, for example, divide the near-infrared (NIR) band by the red band.
"(NIR band)@1" / "(Red band)@1"
 (view larger image)
 (view larger image)
For plant height, subtract a ground-only DSM (baseline) from the DSM taken when the crop has grown.
"(growth-stage DSM)@1" - "(ground DSM)@1"
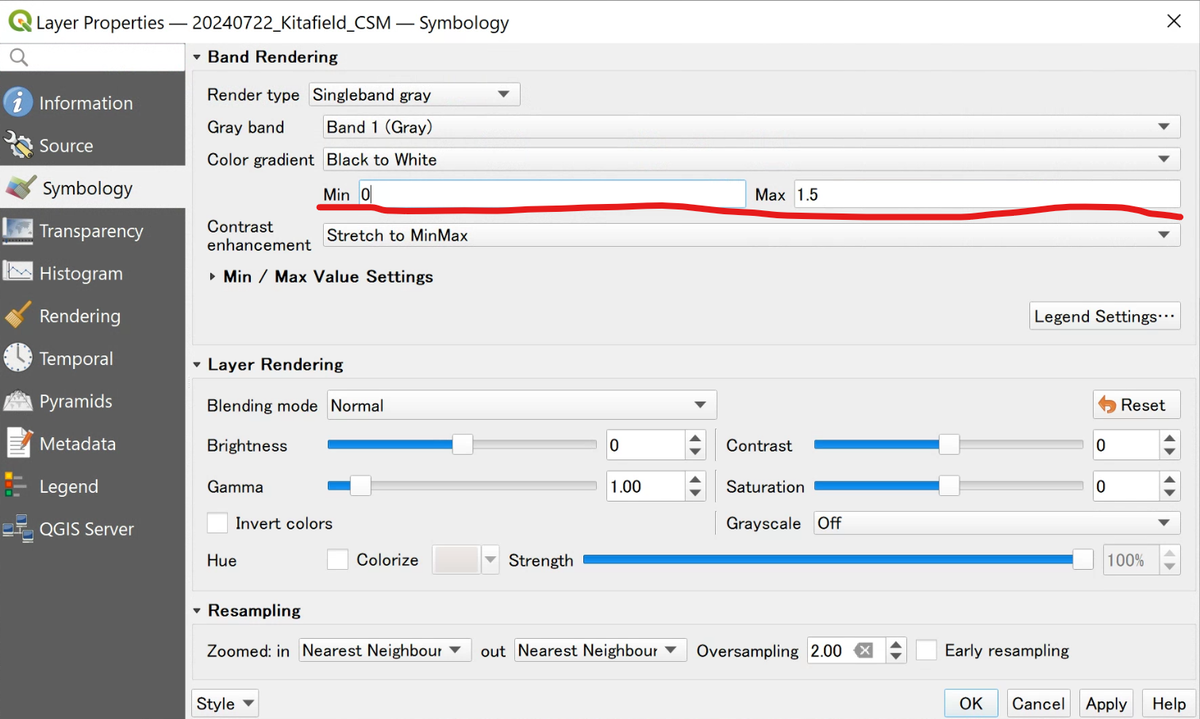
If the result looks too dark to read, adjust the display minimum and maximum (Min / Max) in the layer's "Properties → Symbology" to make the distribution easier to see.
 (view larger image)
Extract a value per polygon (zonal statistics)
Now reduce each feature to a single number per plot. Open "Processing → Toolbox → Raster analysis → Zonal statistics," then set the plot polygons as the input layer and the feature image as the raster layer. Check "Mean" among the statistics and run the tool, and you get the mean of the pixels inside each polygon, plot by plot.
You can save the output as CSV. Leave "Open output file after running algorithm" unchecked so you do not pile up extra layers, which makes the next join easier. Repeat the same step for each feature, such as vegetation indices, plant height, and texture.
Join the extracted features and export
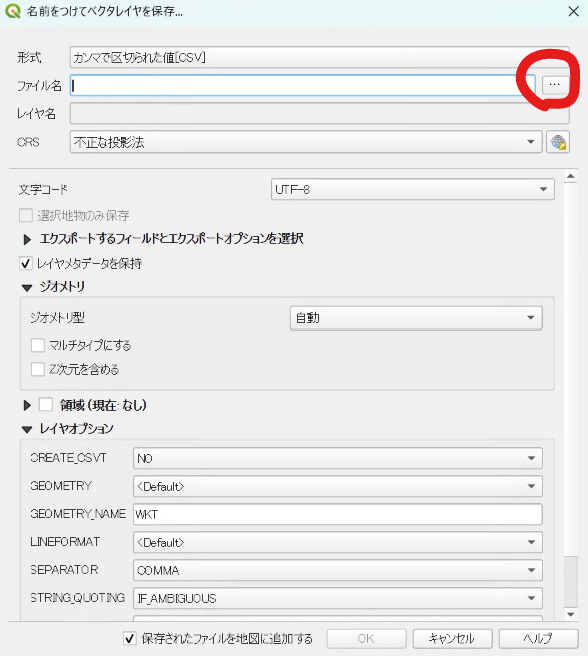
Join the CSV from zonal statistics to the polygons on the same "Joins" tab as in Step 2. Each plot then has its variety, replication, vegetation index, plant height, and other values in one table. Finally, right-click the polygon layer and choose "Export → Save Features As," set the format to CSV, and write it out.
 (view larger image)
You can leave "Add saved file to map" unchecked. Open the exported CSV in Excel and resave it as .xlsx, and it is ready for statistical analysis and plotting.
At this point you have turned drone imagery into a single table of features, one row per plot. Analyze that table and you can compare growth across varieties and treatments in numbers. Start with a single feature to learn the flow, then add others as you go, such as vegetation indices, plant height, and texture.